Logging is the ultimate resource for investigating incidents and learning about what is happening within your application. Every application has logs of some type.
Often, however, those logs are messy and it takes a lot of effort to analyze them. In this article, we’re going to look at how we can make use of structured logging to greatly increase the value of our logs.
We’ll go through some very hands-on tips on what to do to improve the value of an application’s log data and use Logz.io as a logging platform to query the logs.
Example Code
This article is accompanied by a working code example on GitHub.What are Structured Logs?
“Normal” logs are unstructured. They usually contain a message string:
2021-08-08 18:04:14.721 INFO 12402 --- [ main] i.r.s.StructuredLoggingApplication : Started StructuredLoggingApplication in 0.395 seconds (JVM running for 0.552)
This message contains all the information that we want to have when we’re investigating an incident or analyzing an issue:
- the date of the log event
- the name of the logger that created the log event, and
- the log message itself.
All the information is in that log message, but it’s hard to query for this information! Since all the information is in a single string, this string has to be parsed and searched if we want to get specific information out of our logs.
If we want to view only the logs of a specific logger, for example, the log server would have to parse all the log messages, check them for a certain pattern that identifies the logger, and then filter the log messages according to the desired logger.
Structured logs contain the same information but in, well, structured form instead of an unstructured string. Often, structured logs are presented in JSON:
{
  "timestamp": "2021-08-08 18:04:14.721",
  "level": "INFO",
  "logger": "io.reflectoring....StructuredLoggingApplication",
  "thread": "main",
  "message": "Started StructuredLoggingApplication ..."
}
This JSON structure allows log servers to efficiently store and, more importantly, retrieve the logs.
The logs can now easily be filtered by timestamp or logger, for example, and the search is much more efficient than parsing strings for certain patterns.
But the value of structured logs doesn’t end here: we can add any custom fields to our structured log events that we wish! We can add contextual information that can help us identify issues, or we can add metrics to the logs.
With all the data that we now have at our fingertips we can create powerful log queries and dashboards and we’ll find the information we need even when we’ve just been woken up in the middle of a night to investigate an incident.
Let’s now look into a few use cases that show the power of structured logging.
Add a Code Path to All Log Events
The first thing we’re going to look at is code paths. Each application usually has a couple of different paths that incoming requests can take through the application. Consider this diagram:
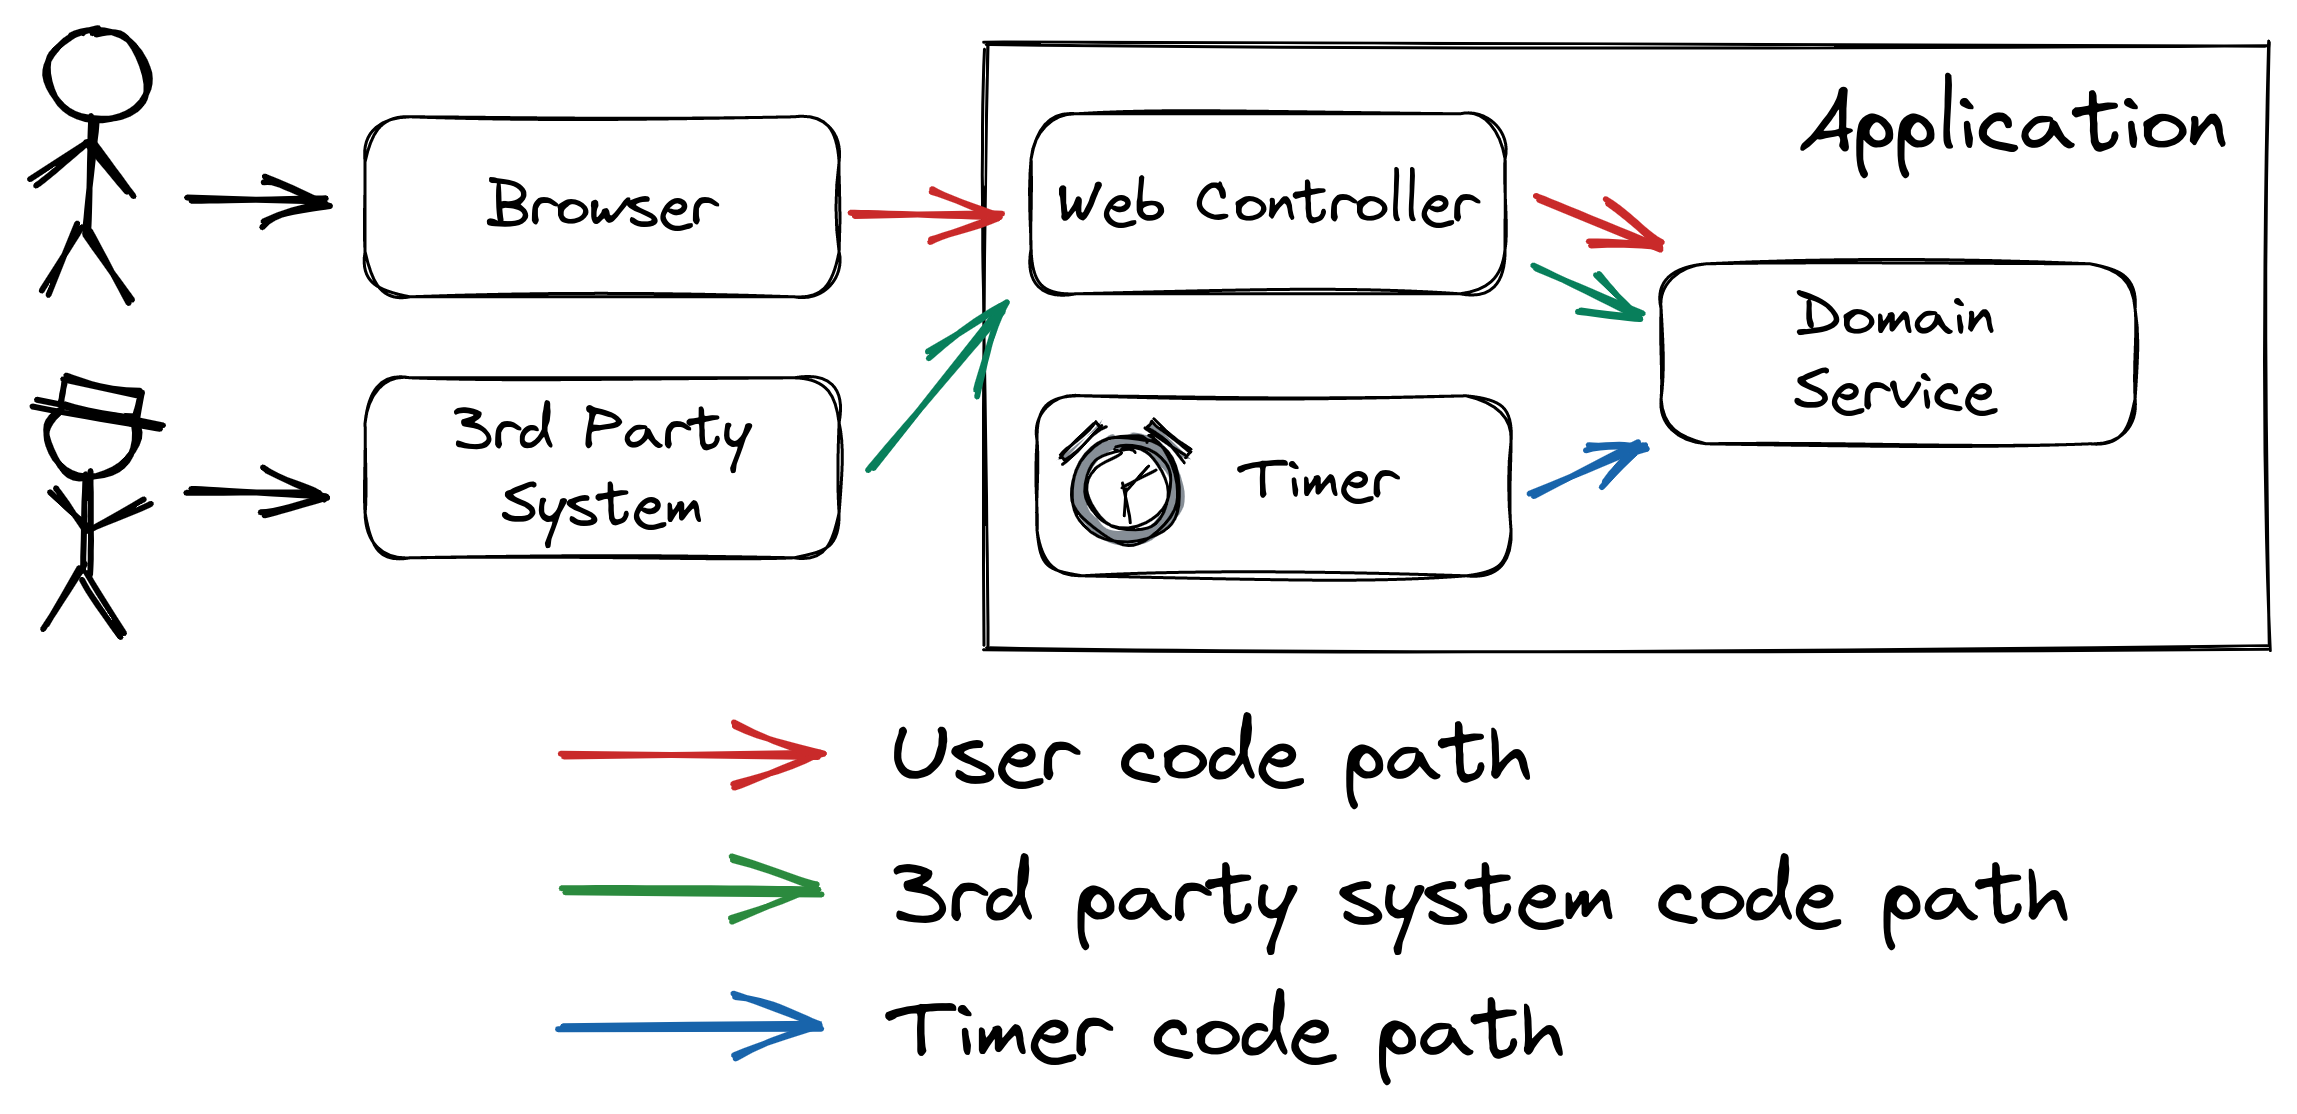
This example has (at least) three different code paths that an incoming request can take:
- User code path: Users are using the application from their browser. The browser sends requests to a web controller and the controller calls the domain code.
- 3rd party system code path: The application’s HTTP API is also called from a 3rd party system. In this example, the 3rd party system calls the same web controller as the user’s browser.
- Timer code path: As many applications do, this application has some scheduled tasks that are triggered by a timer.
Each of these code paths can have different characteristics. The domain service is involved in all three code paths. During an incident that involves an error in the domain service, it will help greatly to know which code path has led to the error!
If we didn’t know the code path, we’d be tempted to make guesses during an incident investigation that lead nowhere.
So, we should add the code path to the logs! Here’s how we can do this with Spring Boot.
Adding the Code Path for Incoming Web Requests
In Java, the SLF4J logging library provides the MDC class (Message Diagnostic Context). This class allows us to add custom fields to all log events that are emitted in the same thread.
To add a custom field for each incoming web request, we need to build an interceptor that adds the codePath field at the start of each request, before our web controller code is even executed.
We can do this by implementing the HandlerInterceptor interface:
public class LoggingInterceptor implements HandlerInterceptor {

  @Override
  public boolean preHandle(HttpServletRequest request, HttpServletResponse response, Object handler) throws Exception {

    if (request.getHeader("X-CUSTOM-HEADER") != null) {
      MDC.put("codePath", "3rdParty");
    } else {
      MDC.put("codePath", "user");
    }

    return true;
  }

  @Override
  public void postHandle(HttpServletRequest request, HttpServletResponse response, Object handler, ModelAndView modelAndView) {
    MDC.remove("codePath");
  }
}
In the preHandle() method, we call MDC.put() to add the codePath field to all log events. If the request contains a header that identifies that the request comes from the 3rd party system, we set the code path to 3rdParty, otherwise, we assume the request is coming from a user’s browser.
Depending on the application, the logic might be vastly different here, of course, this is just an example.
In the postHandle() method we shouldn’t forget to call MDC.remove() to remove all previously set fields again because otherwise, the thread would still keep those fields, even when it goes back to a thread pool, and the next request served by that thread might still have those fields set to the wrong values.
To activate the interceptor, we need to add it to the InterceptorRegistry:
@Component
public class WebConfigurer implements WebMvcConfigurer {

  @Override
  public void addInterceptors(InterceptorRegistry registry) {
    registry.addInterceptor(new LoggingInterceptor());
  }
}
That’s it. All log events that are emitted in the thread of an incoming log event now have the codePath field.
If any request creates and starts a child thread, make sure to call MDC.put() at the start of the new thread’s life, as well.
Check out the log querying section to see how we can use the code path in log queries.
Adding the Code Path in a Scheduled Job
In Spring Boot, we can easily create scheduled jobs by using the @Scheduled and @EnableScheduling annotations.
To add the code path to the logs, we need to make sure to call MDC.put() as the first thing in the scheduled method:
@Component
public class Timer {

  private final DomainService domainService;

  private static final Logger logger = LoggerFactory.getLogger(Timer.class);

  public Timer(DomainService domainService) {
    this.domainService = domainService;
  }

  @Scheduled(fixedDelay = 5000)
  void scheduledHello() {
    MDC.put("codePath", "timer");
    logger.info("log event from timer");

    // do some actual work

    MDC.remove("codePath");
  }

}
This way, all log events emitted from the thread that executes the scheduled method will contain the field codePath. We could also create our own @Job annotation or similar that does that job for us, but that is outside of the scope of this article.
To make the logs from a scheduled job even more valuable, we could add additional fields:
job_status: A status indicating whether the job was successful or not.job_id: The ID of the job that was executed.job_records_processed: If the job does some batch processing, it could log the number of records processed.- …
With these fields in the logs, we can query the log server for a lot of useful information!
Add a User ID to User-Initiated Log Events
The bulk of work in a typical web application is done in web requests that come from a user’s browser and trigger a thread in the application that creates a response for the browser.
Imagine some error happened and the stack trace in the logs reveals that it has something to do with a specific user configuration. But we don’t know which user the request was coming from!
To alleviate this, it’s immensely helpful to have some kind of user ID in all log events that have been triggered by a user.
Since we know that incoming web requests are mostly coming directly from a user’s browser, we can add the username field in the same LoggingInterceptor that we’ve created to add the codePath field:
public class LoggingInterceptor implements HandlerInterceptor {

  @Override
  public boolean preHandle(HttpServletRequest request, HttpServletResponse response, Object handler) throws Exception {

    Object principal = SecurityContextHolder.getContext().getAuthentication().getPrincipal();

    if (principal instanceof UserDetails) {
      String username = ((UserDetails) principal).getUsername();
      MDC.put("username", username);
    } else {
      String username = principal.toString();
      MDC.put("username", username);
    }

    return true;
  }

  @Override
  public void postHandle(HttpServletRequest request, HttpServletResponse response, Object handler, ModelAndView modelAndView) {
    MDC.remove("username");
  }
}
This code assumes we’re using Spring Security to manage access to our web application. We’re using the SecurityContextHolder to get a hold of the Principal and extract a user name from this to pass it into MDC.put().
Every log event emitted from the thread serving the request will now contain the username field with the name of the user.
With that field, we can now filter the logs for requests of specific users. If a user reports an issue, we can filter the logs for their name and reduce the logs we have to sight immensely.
Depending on regulations, you might want to log a more opaque user ID instead of the user name.
Check out the log querying section to see how we can use the user ID to query logs.
Add a Root Cause to Error Log Events
When there is an error in our application, we usually log a stack trace. The stack trace helps us to identify the root cause of the error. Without the stack trace, we wouldn’t know which code was responsible for the error!
But stack traces are very unwieldy if we want to run statistics on the errors in our application. Say we want to know how many errors our application logs in total each day and how many of those are caused by which root cause exception. We’d have to export all stack traces from the logs and do some manual filtering magic on them to get an answer to that question!
If we add the custom field rootCause to each error log event, however, we can filter the log events by that field and then create a histogram or a pie chart of the different root causes in the UI of the log server without even exporting the data.
A way of doing this in Spring Boot is to create an @ExceptionHandler:
@ControllerAdvice
public class WebExceptionHandler {

  private static final Logger logger = LoggerFactory.getLogger(WebExceptionHandler.class);

  @ExceptionHandler(Exception.class)
  @ResponseStatus(HttpStatus.INTERNAL_SERVER_ERROR)
  public void internalServerError(Exception e) {
    MDC.put("rootCause", getRootCause(e).getClass().getName());
    logger.error("returning 500 (internal server error).", e);
    MDC.remove("rootCause");
  }

  private Throwable getRootCause(Exception e) {
    Throwable rootCause = e;
    while (e.getCause() != null && rootCause.getCause() != rootCause) {
      rootCause = e.getCause();
    }
    return rootCause;
  }

}
We create a class annotated with @ControllerAdvice, which means that it’s valid across all our web controllers.
Within the class, we create a method annotated with @ExceptionHandler. This method is called for all exceptions that bubble up to any of our web controllers. It sets the rootCause MDC field to the fully-qualified name of the exception class that caused the error and then logs the stack trace of the exception.
That’s it. All the log events that print a stack trace will now have a field rootCause and we can filter by this field to learn about the error distribution in our application.
Check out the log querying section to see how we can create a chart with the error distribution of our application.
Add a Trace ID to all Log Events
If we’re running more than one service, for example in a microservice environment, things can quickly get complicated when analyzing an error. One service calls another, which calls another service and it’s very hard (if at all possible) to trace an error in one service to an error in another service.
A trace ID helps to connect log events in one service and log events in another service:
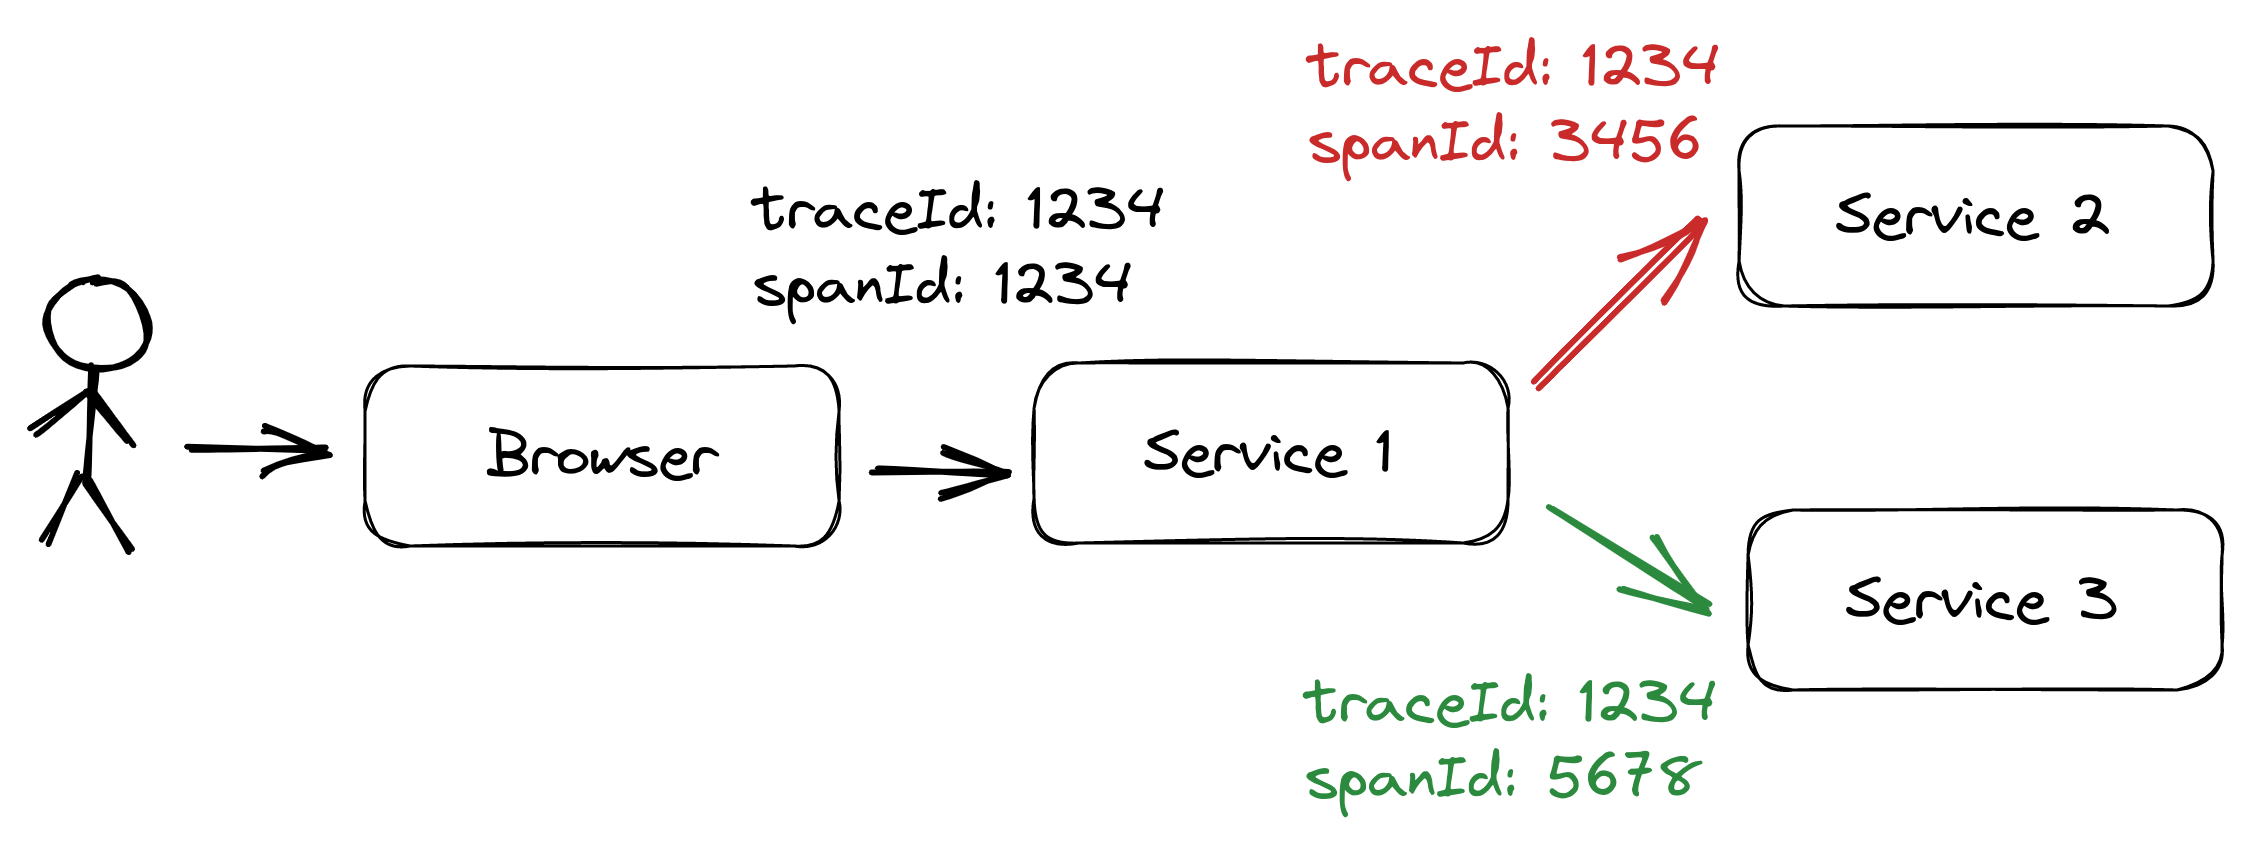
In the example diagram above, Service 1 is called and generates the trace ID “1234”. It then calls Services 2 and 3, propagating the same trace ID to them, so that they can add the same trace ID to their log events, making it possible to connect log events across all services by searching for a specific trace ID.
For each outgoing request, Service 1 also creates a unique “span ID”. While a trace spans the whole request/response cycle of Service 1, a span only spans the request/response cycle between one service and another.
We could implement a tracing mechanism like this ourselves, but there are tracing standards and tools that use these standards to integrate into tracing systems like Logz.io’s distributed tracing feature.
So, we’ll stick to using a standard tool for this. In the Spring Boot world, this is Spring Cloud Sleuth, which we can add to our application by simply adding it to our pom.xml:
<dependencyManagement>
  <dependencies>
    <dependency>
      <groupId>org.springframework.cloud</groupId>
      <artifactId>spring-cloud-dependencies</artifactId>
      <version>2020.0.3</version>
      <type>pom</type>
      <scope>import</scope>
    </dependency>
  </dependencies>
</dependencyManagement>
<dependencies>
  <dependency>
    <groupId>org.springframework.cloud</groupId>
    <artifactId>spring-cloud-starter-sleuth</artifactId>
  </dependency>
</dependencies>
This automatically adds trace and span IDs to our logs and propagates them from one service to the next via request headers when using supported HTTP clients. You can read more about Spring Cloud Sleuth in the article “Tracing in Distributed Systems with Spring Cloud Sleuth”.
Add Durations of Certain Code Paths
The total duration our application requires to answer a request is an important metric. If it’s too slow users are getting frustrated.
Usually, it’s a good idea to expose the request duration as a metric and create dashboards that show histograms and percentiles of the request duration so that we know the health of our application at a glance and maybe even get alerted when a certain threshold is breached.
We’re not looking at the dashboards all the time, however, and we might be interested not only in the total request duration but in the duration of certain code paths. When analyzing logs to investigate an issue, it can be an important clue to know how long a certain path in the code took to execute.
In Java, we might do something like this:
void callThirdPartyService() throws InterruptedException {
  logger.info("log event from the domain service");

  Instant start=Instant.now();
  Thread.sleep(2000); // simulating an expensive operation
  Duration duration=Duration.between(start,Instant.now());

  MDC.put("thirdPartyCallDuration",String.valueOf(duration.getNano()));
  logger.info("call to third-party service successful!");
  MDC.remove("thirdPartyCallDuration");
}
Say we’re calling a third-party service and would like to add the duration to the logs. Using Instant.now() and Duration.between(), we calculate the duration, add it to the MDC, and then create a log event.
This log event will now have the field thirdPartyCallDuration which we can filter and search for in our logs. We might, for example, search for instances where this call took extra long. Then, we could use the user ID or trace ID, which we also have as fields on the log event to figure out a pattern when this takes especially long.
Check out the log querying section to see how we can filter for long queries using Logz.io.
Querying Structured Logs in Logz.io
If we have set up logging to Logz.io like described in the article about per-environment logging, we can now query the logs in the Kibana UI provided by Logz.io.
Error Distribution
We can, for example, query for all log events that have a value in the rootCause field:
__exists__: "rootCause"
This will bring up a list of error events that have a root cause.
We can also create a Visualization in the Logz.io UI to show the distribution of errors in a given time frame:
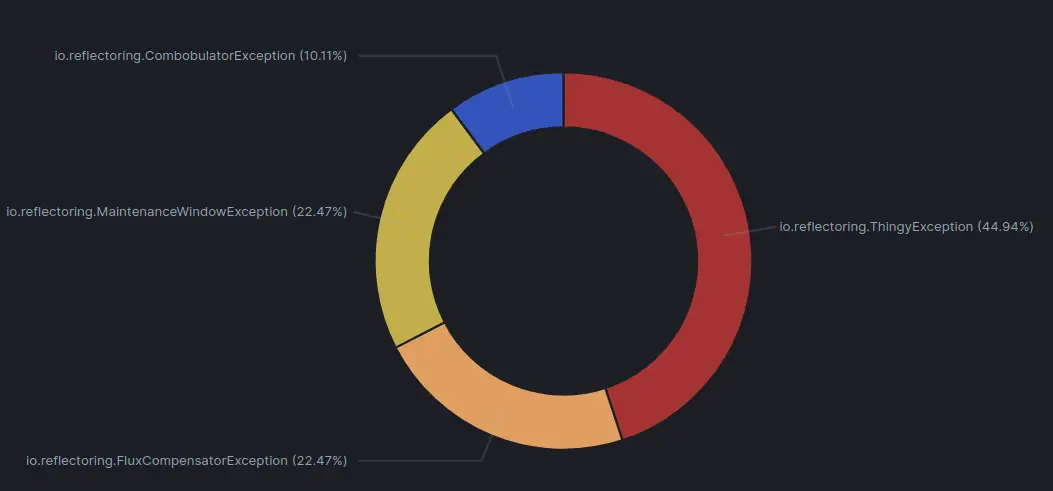
This chart shows that almost half of the errors are caused by a ThingyException, so it might be a good idea to check if this exception can be avoided somehow. If it can’t be avoided, we should log it on WARN instead of ERROR to keep the error logs clean.
Error Distribution Across a Code Path
Say, for example, that users are complaining that scheduled jobs aren’t working correctly. If we have added a job_status field to the scheduled method code, we can filter the logs by those jobs that have failed:
job_status: "ERROR"
To get a more high-level view, we can create another pie chart visualization that shows the distribution of job_status and rootCause:
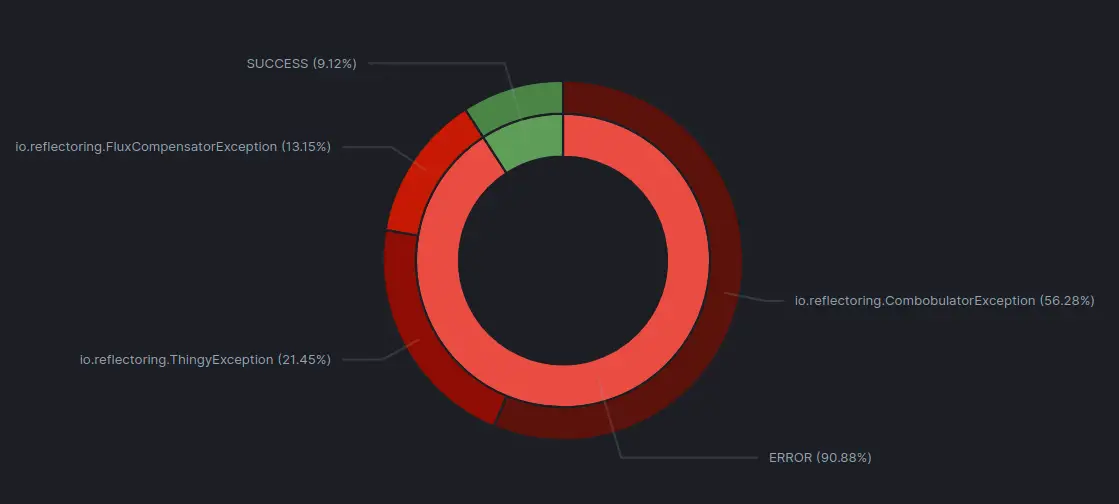
We can now see that the majority of our scheduled jobs is failing! We should add some alerting around this! We can also see which exceptions are the root causes of the most scheduled jobs and start to investigate.
Checking for a User’s Errors
Or, let’s say that the user with the username “user” has raised a support request specifying a rough date and time when it happened. We can filter the logs using the query username: user to only show the logs for that user and can quickly zero in on the cause of the user’s issue.
We can also extend the query to show only log events of that user that have a rootCause to directly learn about what went wrong when.
username: "user" AND _exists_: "rootCause"
Structure Your Logs
This article showed just a few examples of how we can add structure to our log events and make use of that structure while querying the logs. Anything that should later be searchable in the logs should be a custom field in the log events. The fields that make sense to add to the log events highly depend on the application we’re building, so make sure to think about what information would help you to analyze the logs when you’re writing code.
You can find the code samples discussed in this article on GitHub.