In a distributed system, many services can be involved in creating a response to a single request. Not only for debugging purposes it’s essential that the path of such a request can be traced through all involved services. This tutorial gives an overview of the traceability problem in distributed systems and provides a complete guide on how to implement tracing with Spring Boot, OpenTelemetry, and Jaeger.
Example Code
This article is accompanied by a working code example on GitHub.Spans and Traces
Even in a monolithic system, tracing a bug can be hard enough. To find the root cause of an error you search through the log files of the application servers around the point in time the error occurred and hope that you find a stack trace that explains the error. Ideally, the error message contains a correlation ID that uniquely identifies the error, so that you can just search for that correlation ID in the log files. It’s a plus when the log files are structured and aggregated in a central, searchable log service like Logz.io.
In a distributed system, tracing gets even harder since many different services running on different machines may be involved in responding to a single request. Here, a central log server and a correlation ID are not negotiable. But the correlation ID can now come from any of a set of distributed services.
As an example for this article, let’s have a look at a distributed system with two services:
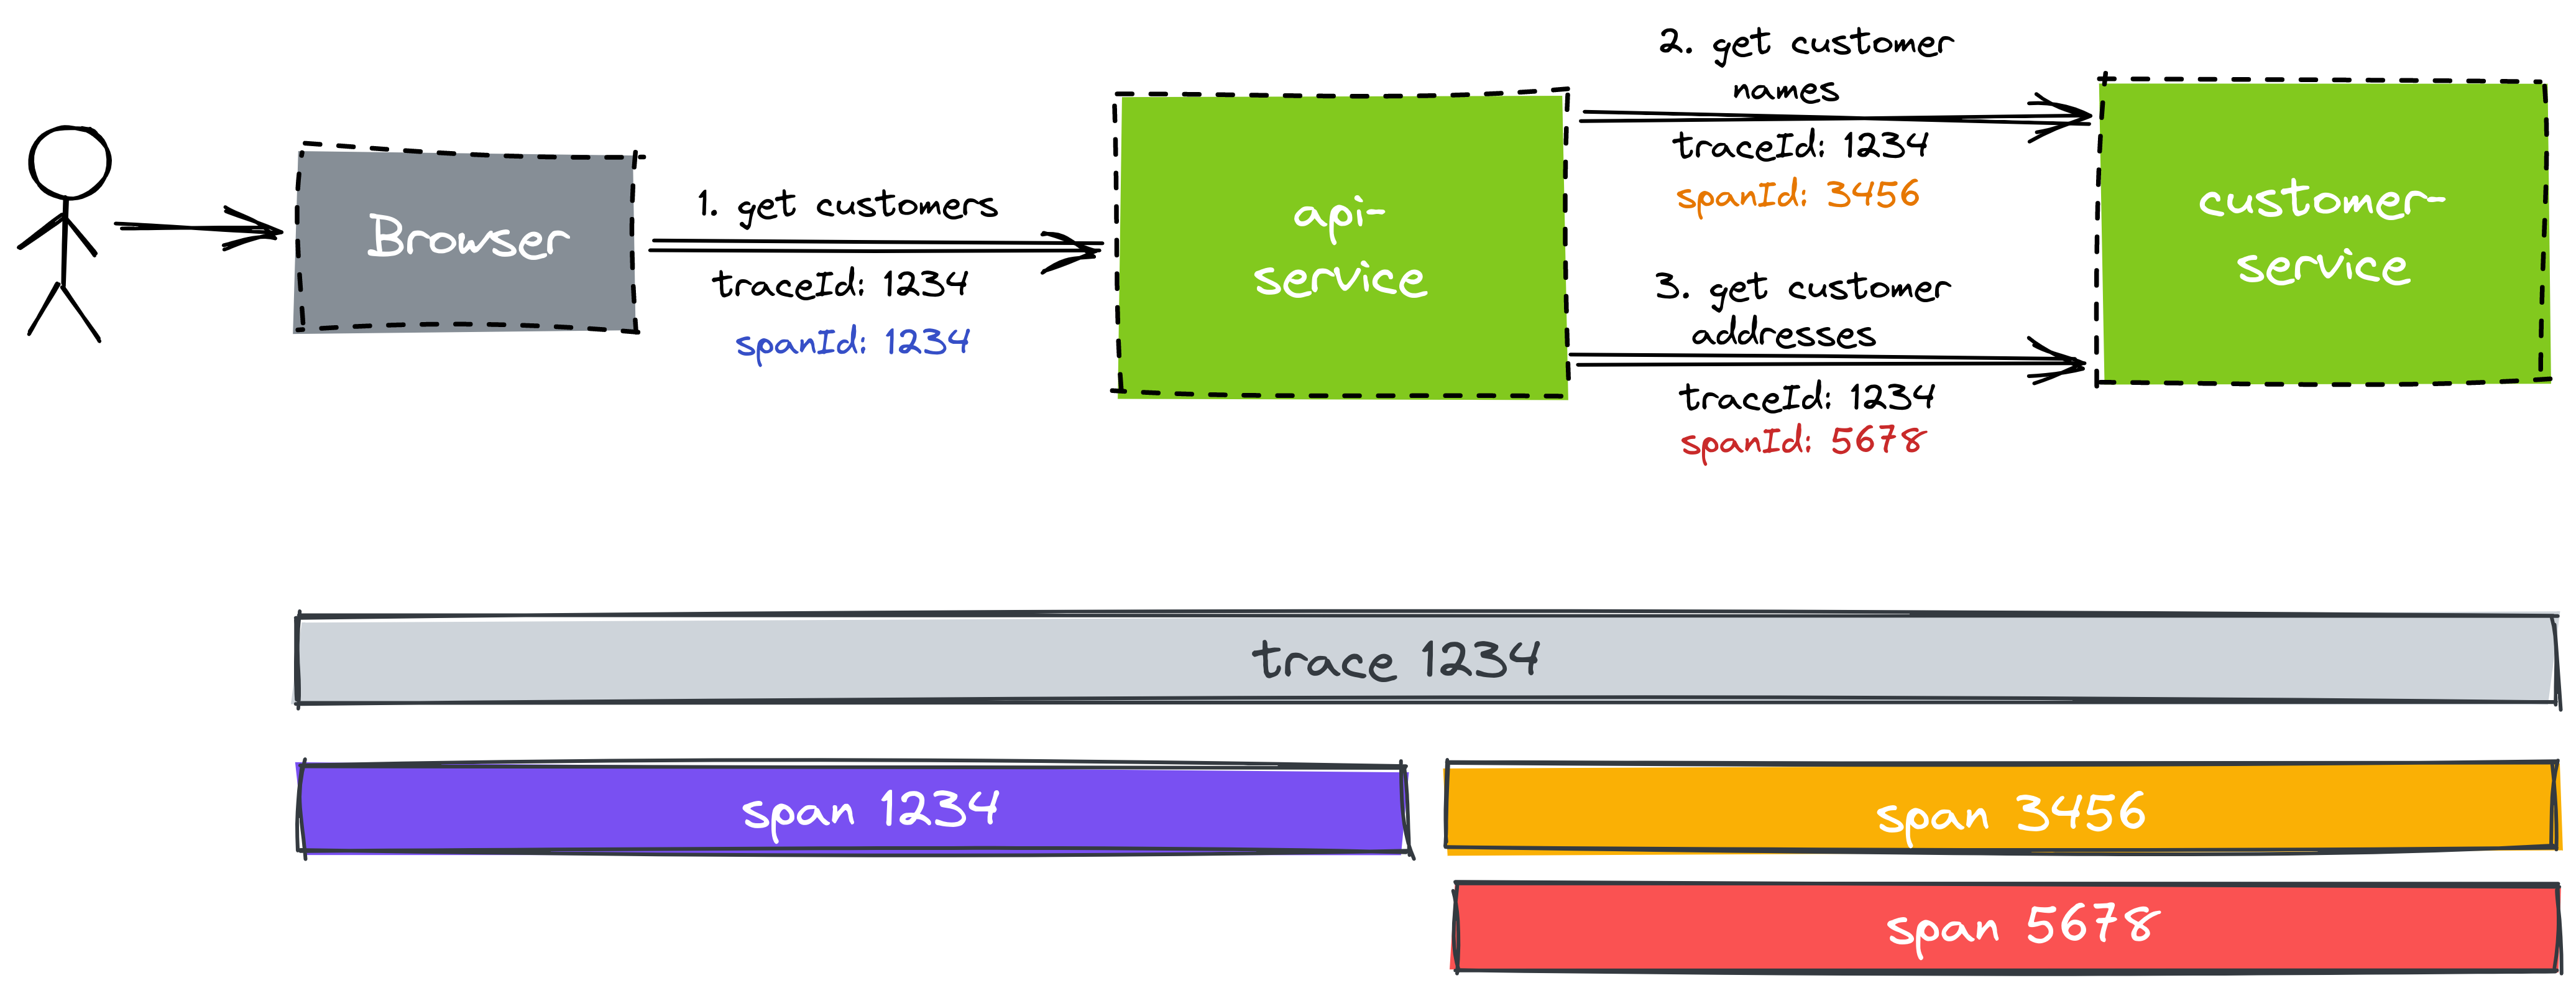
The browser makes a request to the API service to get a detail view of a customer and display it to the user. The API service can’t answer that request by itself and has to make two calls to the customer service to get the names and addresses of the customers, respectively.
This is just a simple example for this article. In the real world, there can be dozens of services involved in answering a request.
Each “hop” from one service to the next is called a “span”. All spans that are involved in responding to a request to the end-user together make up a “trace”.
Each span and trace gets a unique id. The first span of a trace often re-uses the trace ID as the span ID. Each service is expected to pass the trace ID to the next service it calls so that the next service can use the same trace ID as a correlation ID in its logs. This propagation of the trace ID is usually done via an HTTP header.
In addition to using trace and span IDs in logs, to correlate log output from different services, we can send those traces and spans to a central tracing server that allows us to analyze traces. That’s what we’re going to do in the rest of this article.
The Tracing Setup
Let’s have a look at what we’re going to build in this article:
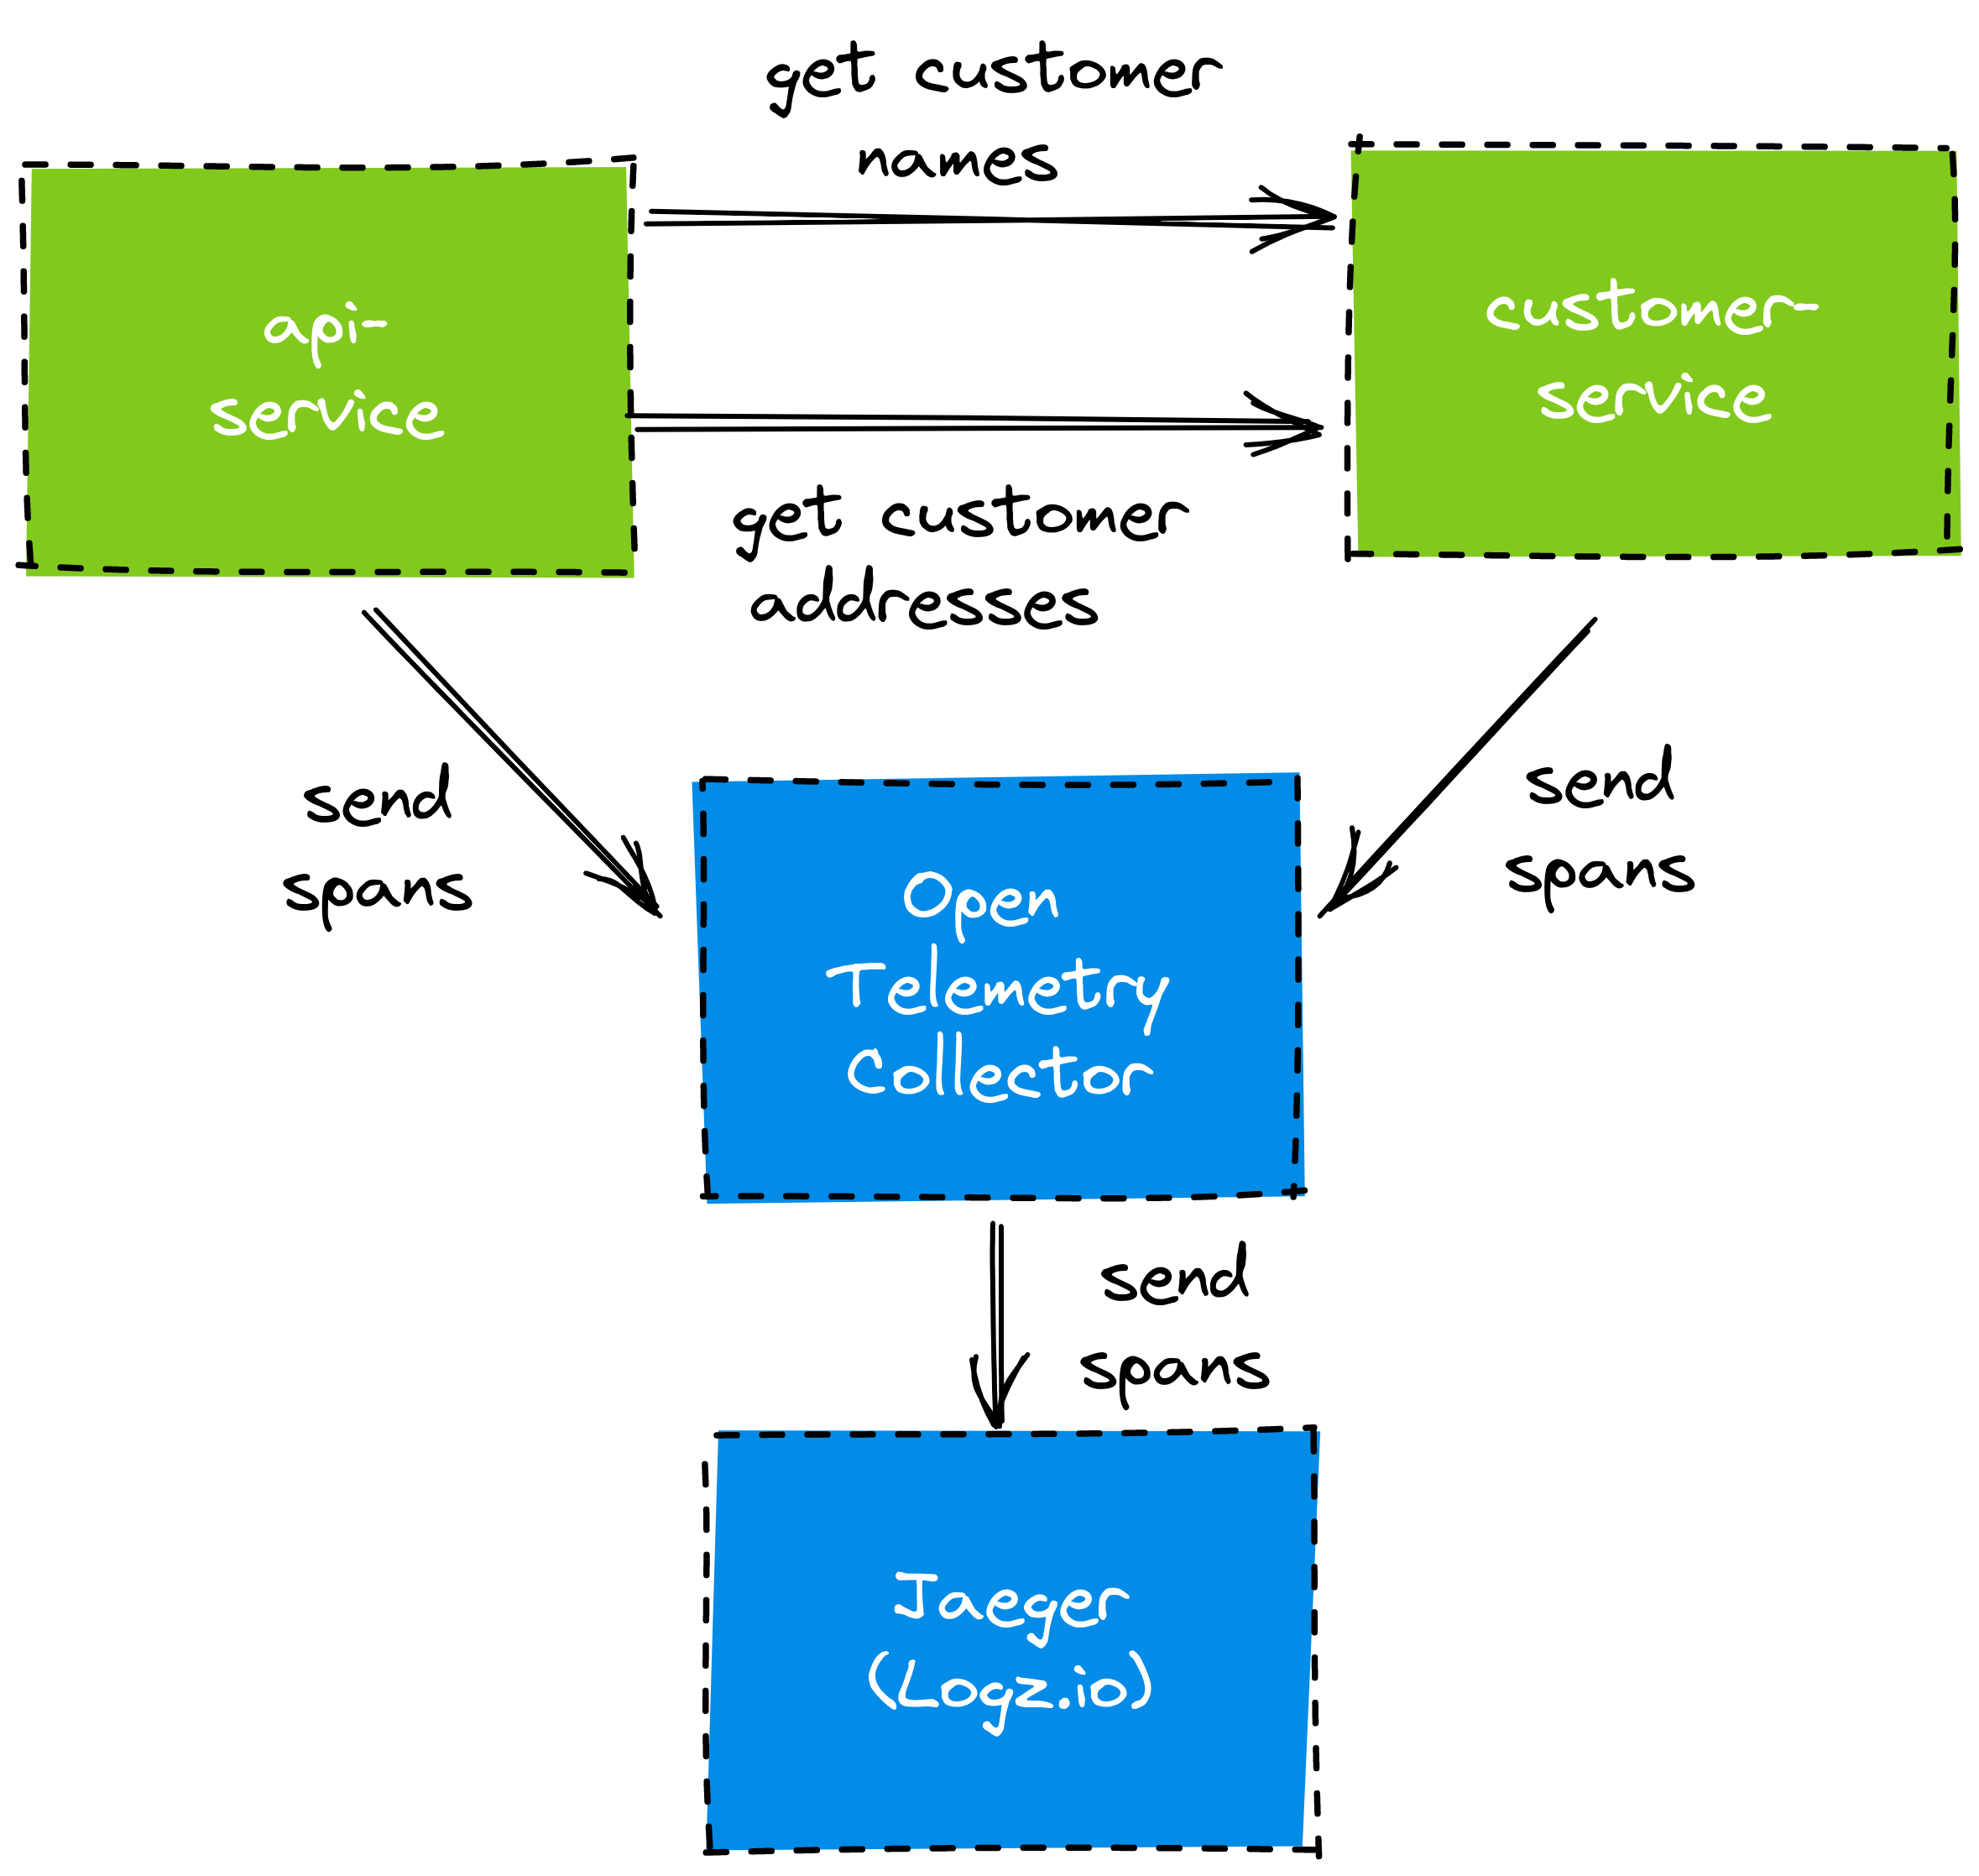
We have the API and customer service that we mentioned above. The API service depends on the customer service to provide customer data. Both services are Spring Boot applications.
Ultimately, we want to use Jaeger as the tool to analyze our traces. Jaeger (German for “hunter”) provides a user interface that allows us to query for and analyze traces. In this article, we are going to use a managed Jaeger instance provided by Logz.io. We’ll need to get the traces from our Spring Boot applications to Jaeger, somehow.
To get the traces and spans to Jaeger, we make a detour through an OpenTelemetry Collector. OpenTelemetry is a project that aims to provide a ubiquitous standard for tracing use cases. The collector aggregates the traces from our services and forwards them to Jaeger.
To propagate traces between our Spring Boot services, we’re using Spring Cloud Sleuth. To send the traces to the OpenTelemetry Collector, we’re using Spring Cloud Sleuth OTel, an extension to Sleuth.
The Example Application
Before we go into the details of setting up tracing, let’s have a look at the example application I’ve built for this tutorial. You can look up the working code on GitHub.
API Service
The API service provides a REST API to get customer data. For this, it exposes the endpoint /customers/{id} implemented in this REST controller:
@RestController
public class Controller {

  private CustomerClient customerClient;

  private AddressClient addressClient;

  private Logger logger = LoggerFactory.getLogger(Controller.class);

  @Autowired
  public Controller(CustomerClient customerClient, AddressClient addressClient) {
    this.customerClient = customerClient;
    this.addressClient = addressClient;
  }

  @GetMapping(path = "customers/{id}")
  public CustomerAndAddress getCustomerWithAddress(@PathVariable("id") long customerId) {
    logger.info("COLLECTING CUSTOMER AND ADDRESS WITH ID {} FROM UPSTREAM SERVICE", customerId);
    Customer customer = customerClient.getCustomer(customerId);
    Address address = addressClient.getAddressForCustomerId(customerId);
    return new CustomerAndAddress(customer, address);
  }
}
This is a pretty standard REST controller. The interesting bit is that it’s making use of an AddressClient and a CustomerClient to call the customer service to get the customer addresses and names, respectively.
Let’s take a look at one of these clients:
@Component
public class CustomerClient {

  private static final Logger logger = LoggerFactory.getLogger(CustomerClient.class);
  private RestTemplate restTemplate;
  private String baseUrl;

  public CustomerClient(
          RestTemplate restTemplate,
          @Value("${customerClient.baseUrl}") String baseUrl) {
    this.restTemplate = restTemplate;
    this.baseUrl = baseUrl;
  }

  Customer getCustomer(@PathVariable("id") long id) {
    String url = String.format("%s/customers/%d", baseUrl, id);
    return restTemplate.getForObject(url, Customer.class);
  }
}
The CustomerClient uses a plain RestTemplate to make REST calls to the customer service. No magic here. The base URL to the customer service is made configurable through Spring’s @Value annotation. To configure the base URL, we add it to the service’s application.yml file:
server:
  port: 8080

addressClient:
  baseUrl: http://customer-service:8081

customerClient:
  baseUrl: http://customer-service:8081
Both base URLs for the addressClient and the customerClient are pointing to the customer service, which we’re going to run in Docker later. To make the whole setup work locally, we configured the API service to run on port 8080 and the customer service to run on port 8081.
Finally, to make the service runnable in Docker, we create a Dockerfile:
FROM adoptopenjdk/openjdk11:alpine-jre
ARG JAR_FILE=target/*.jar
COPY ${JAR_FILE} application.jar
EXPOSE 8080
ENTRYPOINT ["java","-jar","/application.jar"]
After building the service with ./mvnw package, we can now run docker build to package the service in a Docker container.
Customer Service
The customer service looks very similar. It has a REST controller that provides the /customers/{id} and /addresses/{id} endpoints, that return the customer name and address for a given customer ID:
@RestController
public class Controller {

  private Logger logger = LoggerFactory.getLogger(Controller.class);

  @GetMapping(path = "customers/{id}")
  public ResponseEntity<Customer> getCustomer(@PathVariable("id") long customerId) {
    logger.info("GETTING CUSTOMER WITH ID {}", customerId);
    Customer customer = // ... get customer from "database"
    return new ResponseEntity<>(customer, HttpStatus.OK);
  }

  @GetMapping(path = "addresses/{id}")
  public ResponseEntity<Address> getAddress(@PathVariable("id") long customerId) {
    logger.info("GETTING ADDRESS FOR CUSTOMER WITH ID {}", customerId);
    Address address = // ... get address from "database"
    return new ResponseEntity<>(address, HttpStatus.OK);
  }
}
In the example implementation on GitHub, the controller has a hard-coded list of customer names and addresses in memory and returns one of those.
The customer service’s application.yml file looks like this:
server.port: 8081
As mentioned above, we change the port of the customer service to 8081 so it doesn’t clash with the API service on port 8080 when we run both services locally.
The Dockerfile of the customer service looks exactly like the Dockerfile of the API service:
FROM adoptopenjdk/openjdk11:alpine-jre
ARG JAR_FILE=target/*.jar
COPY ${JAR_FILE} application.jar
EXPOSE 8080
ENTRYPOINT ["java","-jar","/application.jar"]
Configuring Spring Boot to Send Traces to an OpenTelemetry Collector
Next, we’re going to add Spring Cloud Sleuth to our Spring Boot services and configure it to send traces to our OpenTelemetry Collector.
First, we need to add some configuration to each of our services' pom.xml:
<properties>
  <release.train.version>2020.0.4</release.train.version>
  <spring-cloud-sleuth-otel.version>1.0.0-M12</spring-cloud-sleuth-otel.version>
</properties>

<dependencyManagement>
  <dependencies>
    <dependency>
      <groupId>org.springframework.cloud</groupId>
      <artifactId>spring-cloud-dependencies</artifactId>
      <version>${release.train.version}</version>
      <type>pom</type>
      <scope>import</scope>
    </dependency>
    <dependency>
      <groupId>org.springframework.cloud</groupId>
      <artifactId>spring-cloud-sleuth-otel-dependencies</artifactId>
      <version>${spring-cloud-sleuth-otel.version}</version>
      <scope>import</scope>
      <type>pom</type>
    </dependency>
  </dependencies>
</dependencyManagement>

<repositories>
  <repository>
    <id>spring-milestones</id>
    <url>https://repo.spring.io/milestone</url>
  </repository>
</repositories>

<pluginRepositories>
  <pluginRepository>
    <id>spring-milestones</id>
    <url>https://repo.spring.io/milestone</url>
  </pluginRepository>
</pluginRepositories>

<dependencies>
  <dependency>
    <groupId>org.springframework.boot</groupId>
    <artifactId>spring-boot-starter-web</artifactId>
  </dependency>
  <dependency>
    <groupId>org.springframework.boot</groupId>
    <artifactId>spring-boot-starter-actuator</artifactId>
  </dependency>
  <dependency>
    <groupId>org.springframework.cloud</groupId>
    <artifactId>spring-cloud-starter-sleuth</artifactId>
    <exclusions>
      <exclusion>
        <groupId>org.springframework.cloud</groupId>
        <artifactId>spring-cloud-sleuth-brave</artifactId>
      </exclusion>
    </exclusions>
  </dependency>
  <dependency>
    <groupId>org.springframework.cloud</groupId>
    <artifactId>spring-cloud-sleuth-otel-autoconfigure</artifactId>
  </dependency>
  <dependency>
    <groupId>io.opentelemetry</groupId>
    <artifactId>opentelemetry-exporter-otlp-trace</artifactId>
  </dependency>
  <dependency>
    <groupId>io.grpc</groupId>
    <artifactId>grpc-okhttp</artifactId>
    <version>1.42.1</version>
  </dependency>
</dependencies>
This is the whole boilerplate to add Spring Cloud Sleuth including the OpenTelemetry support.
Important to note is that we have to exclude spring-cloud-sleuth-brave from the spring-cloud-starter-sleuth dependency and instead add in the spring-cloud-sleuth-otel-autoconfigure dependency. This replaces the default tracing implementation based on Brave with the implementation based on OpenTelemetry.
Also, we have to add the opentelemetry-exporter-otlp-trace and grpc-okhttp dependencies to make the OpenTelemetry Exporter work. The OpenTelemetry Exporter is the component in Spring Cloud Sleuth OTel that sends traces to an OpenTelemetry Collector.
By now, the setup will already propagate trace IDs across service boundaries. I.e. Sleuth automatically configures the RestTemplate used in the API service to add the trace ID in an HTTP header and the customer service will automatically read this header and attach the trace ID to the threads that are processing incoming requests.
After this is done, we need to update our services' application.yml files:
spring:
  application:
    name: api-service # or "customer-service"

  sleuth:
    otel:
      exporter:
        otlp:
          endpoint: http://collector:4317
We set the spring.application.name property to the name of the respective service. Spring Cloud Sleuth will use this name in the traces it sends, so it’s kind of important if we want to know which services were involved in a specific trace.
We also set the spring.sleuth.otel.exporter.otlp.endpoint property to point to our OpenTelemetry collector (we’ll later start the collector in Docker). Sleuth will now send the traces in OpenTelemetry format to that endpoint.
With this configuration done, we’re ready to combine all the pieces and run everything on our local machines in Docker.
Running Everything in Docker
To test the setup, we run everything in Docker Compose: the API service, the customer service, and the OpenTelemetry Collector. For this, we create a docker-compose.yml file with the following content:
services:

  api-service:
    build: api-service/
    image: api-service:latest
    ports:
      - "8080:8080"

  customer-service:
    build: ./customer-service/
    image: customer-service:latest
    ports:
      - "8081:8081"

  collector:
    image: logzio/otel-collector-traces
    environment:
      - LOGZIO_REGION=${LOGZIO_REGION}
      - LOGZIO_TRACES_TOKEN=${LOGZIO_TRACES_TOKEN}
    ports:
      - "1777:1777"
      - "9411:9411"
      - "9943:9943"
      - "6831:6831"
      - "6832:6832"
      - "14250:14250"
      - "14268:14268"
      - "4317:4317"
      - "55681:55681"
      - "8888:8888"
This will spin up both our Spring Boot services using Docker’s build command. It requires that we run the docker-compose command from the parent directory that contains both the api-service and the customer-service sub-directories. Don’t forget to run ./mvnw clean package before running docker-compose, because otherwise, you might start an old version of our services.
Additionally, we include a collector service based on the logzio/otel-collector-traces Docker image provided by Logz.io. This image contains an OpenTelemetry Collector that is preconfigured to send the traces to Logz.io. It requires the environment variables LOGZIO_REGION and LOGZIO_TRACES_TOKEN, which you will get in the “Tracing” section of your Logz.io account. You can clone the example code from GitHub and register for a free Logz.io trial if you want to play along.
If we run LOGZIO_REGION=... LOGZIO_TRACES_TOKEN=... docker-compose up now, Docker will start all three components locally and we’re ready to generate and analyze some traces!
Analyzing Traces in Jaeger
With the Docker Compose stack up and running, we can now hit the API service’s endpoint. You can type https://localhost:8080/customers/1 into your browser to call the API service and the API service will, in turn, call the customer service to get the names and addresses. Your browser should show something like this:
{
  "customer": {
    "id": 1,
    "name": "Yukiko Yawn"
  },
  "address": {
    "id": 1,
    "street": "Cambridge Road"
  }
}
If you look at the log output from the docker-compose command, you should also see some activity there. It will show something like this:
api-service_1       | INFO [api-service,e9d9d371ac07ea32bdb12c4d898535ee,a96ea4b352976715] : COLLECTING CUSTOMER AND ADDRESS WITH ID 1 FROM UPSTREAM SERVICE
customer-service_1  | INFO [customer-service,e9d9d371ac07ea32bdb12c4d898535ee,f69c5aa9ddf8624c] : GETTING CUSTOMER WITH ID 1
customer-service_1  | INFO [customer-service,e9d9d371ac07ea32bdb12c4d898535ee,dd27f1fefaf7b9aa] : GETTING ADDRESS FOR CUSTOMER WITH ID 1
The logs show that the API service has received the request from our browser and created the trace ID e9d9... and the span ID a96e.... The following log events show that the customer service has received two requests to get the customer name and address and that it’s using the same trace ID in the logs, but a different span ID each time.
After a minute or so, we should also see the traces in the Logz.io Jaeger dashboard and we can now run some queries.
Browsing Traces
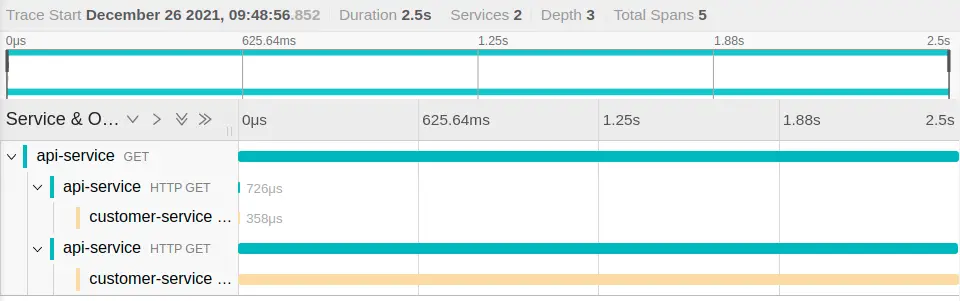
In the Jaeger UI, we can now browse the traces and will see something like this:
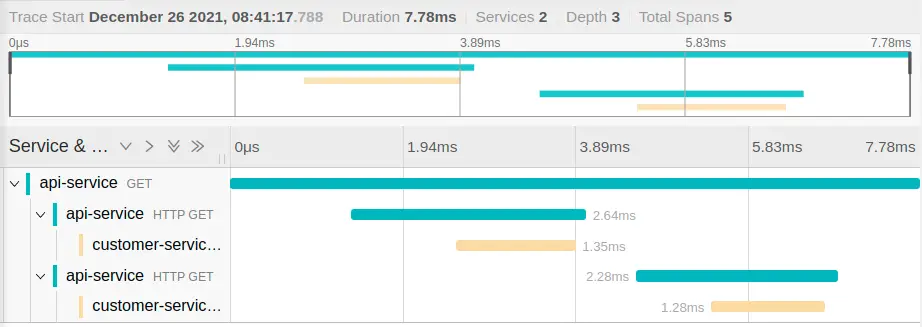
This is exactly what we expected: the API service received an HTTP GET request and then makes two consecutive calls to the customer service. We can see that the API service made the first call to the customer service approximately 2ms after it got the request from the browser and that the customer service took 1.35ms to respond. This gives great visibility to where our services spend their time!
Clicking on one of the elements of the trace, we can expand it and view all the tags that Spring Cloud Sleuth has added to the trace:
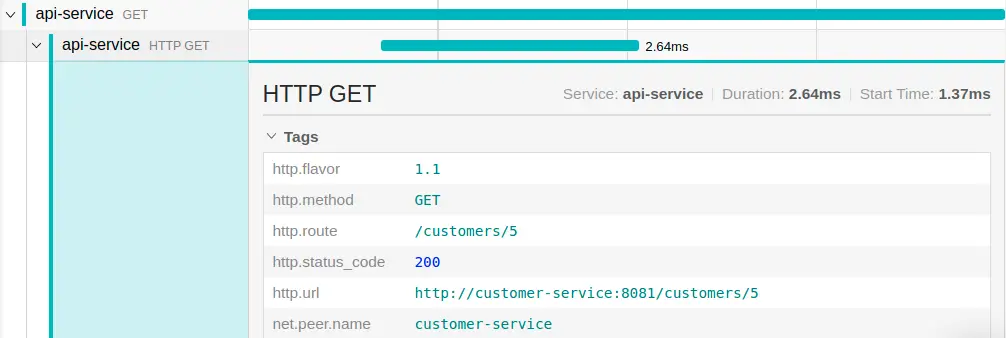
If we want, we can add custom tags to our traces using Spring Cloud Sleuth’s tagging feature.
The tags are indexed and searchable in Jaeger, making for a very convenient way to investigate issues in a distributed system.
Let’s look at a few tracing use cases.
Finding Long-running Spans
Imagine that users are complaining about slowly loading pages but every user is complaining about a different page so we don’t know what’s causing this performance issue.
The Jaeger UI allows us to search for traces that have been longer than a given time. We can search for all traces that have taken longer than 1000ms, for example. Drilling down into one of the long-running traces of our example app, we might get a result like this:
This shows very clearly that the most time in this trace is spent in the second call to the customer service, so we can focus our investigation on that code to improve it. And indeed, I had added a Thread.sleep() to that piece of code.
Finding Traces with Errors
Say a user is complaining about getting errors on a certain page of the application but to render that page the application is calling a lot of other services and we want to know which service is responsible for the error.
In the Jaeger UI, we can search for http.status_code=500 and will see something like this:
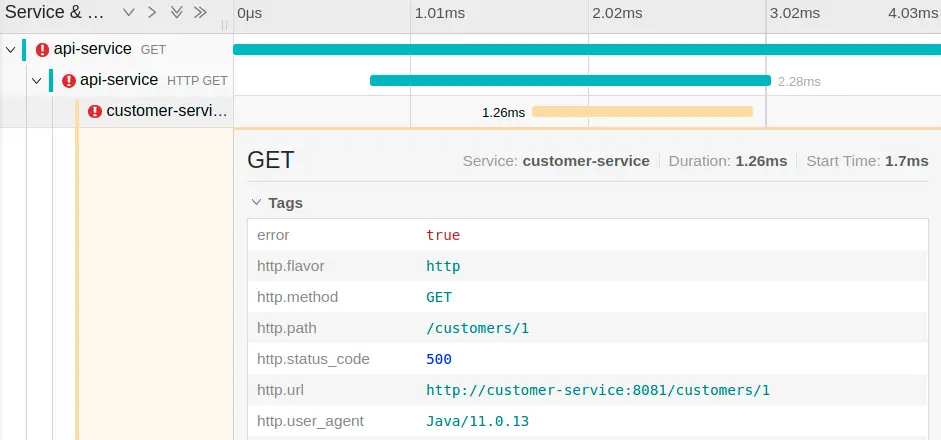
This shows clearly that the call to http://customer-service:8081/customers/1 is the culprit and we can focus on that code to fix the error.
Finding Traces that Involve a specific Controller
Another use case for tracing is to help make decisions for future development. Say we want to make a change to the REST API of our customer service and want to notify the teams that are using this API so they know about the upcoming change. We can search for service=customer-service mvc.controller.class=Controller to get a list of all traces that go through this REST controller.
We would see at a glance which other services we would need to notify about the upcoming API changes. This requires that all of those other services are sending their traces to Jaeger, of course.
Conclusion
Above, we have discussed a few tracing use cases, but there are a lot more in real distributed systems.
Tracing is a very powerful tool that makes the chaos of distributed systems a little more manageable. You’ll get the most out of it if all your services are instrumented properly and are sending traces to a central tracing dashboard like Jaeger.
To save the hassle of installing and running your own Jaeger instance, you can use one managed in the cloud by a provider like Logz.io, as I did in this article.