The primary purpose of logging in applications is to debug and trace one or more root causes of an unexpected behavior. We take various approaches to logging from putting ad-hoc print statements to embedding sophisticated logging libraries in our code.
Irrespective of which approach we take, a log without a consistent structure with context information is difficult to search for and locate the root cause of problems.
Amazon CloudWatch is a managed monitoring and logging service which is used as centralized log storage. It can also run queries on structured logs to extract valuable information.
In this article, we will understand:
- how to produce structured logs from applications with an example of producing structured logs from a Spring Boot application
- ingest those structured logs in Amazon CloudWatch
- run queries on the ingested structured logs to extract useful insights into the application
Example Code
This article is accompanied by a working code example on GitHub.What is Structured Logging
Before going further, let us understand Structured logging in a bit more detail.
Structured logging is writing logs with information in a consistent format that allows logs to be treated as data rather than text. We log a structured object, most often as JSON for writing structured logs, instead of just logging a line of text.
The JSON object is composed of fields that can give contextual information about the log event, for example:
- the application name
- class or method name from where the log was produced
- invoker of the method
- DateTime of the logging event
The JSON object may also include the request and response payload in case of API or method calls and optionally the stacktrace in case of errors.
This structured format of logs helps us to search by applying filters, sort, and limit operations on different fields in the structure to gain useful insights about our application.
Here is an example of a structured log:
{
  "instant": {
    "epochSecond": 1682426514,
    "nanoOfSecond": 223252000
  },
  "thread": "http-nio-8080-exec-6",
  "level": "ERROR",
  "loggerName": "***.services.AccountService",
  "message": "Account not found:: 5678000",
  "endOfBatch": false,
  "loggerFqcn": "org.apache.logging.log4j.spi.AbstractLogger",
  "contextMap": {
    "accountNo": "5678000"
  },
  "threadId": 43,
  "threadPriority": 5,
  "appName": "AccountsProcessor",
  "version": "release1.0"
}
In this log, we can see several contextual information like the thread identifier, datetime epoch, and application name apart from the log message: Account not found:: 5678000.
Producing Structured Logs from a Spring Boot Application
We produce structured logs in applications most often by using logging libraries in different programming languages.
Let us use a Spring Boot application for generating structured logs. We can create the initial application setup of our Spring Boot application from the Spring Boot starter and open it in our favorite IDE.
We will use the log4j library to generate structured logs. The snippet of the FileAppender of our Log4j configuration in log4j2.xml looks like this:
<File name="FileAppender"
    fileName="/home/ec2-user/accountprocessor/logs/accountprocessor-logging-dev.log">
    <JsonLayout
        complete="false"
        compact="true"
        eventEol="true"
        properties="true"  >
        <KeyValuePair
            key="appName"
            value="AccountsProcessor" />
        <KeyValuePair
            key="version"
            value="release1.0" />
        <KeyValuePair
            key="accountNo"
            value="${ctx:accountNo}"/>
    </JsonLayout>
</File>
In this FileAppender we have used JsonLayout to generate the logs in JSON format. We have added additional fields: appName, version, and accountNo to add useful context around the log events.
We have also added a sample API to the application to which we will send HTTP GET requests. On receiving these requests, our application will use the log4j configuration to produce structured logs.
@RestController
@RequestMapping("/accounts")
public class AccountInquiryController {

    private AccountService accountService;

    private static final Logger LOG =
        LogManager.getLogger(
            AccountInquiryController.class);


    public AccountInquiryController(
        final AccountService accountService){
          this.accountService = accountService;
    }

    @GetMapping("/{accountNo}")
    @ResponseBody
    public AccountDetail getAccountDetails(
        @PathVariable("accountNo") String accountNo) {

        ThreadContext.put("accountNo", accountNo);
        LOG.info(
            "fetching account details for account {}", accountNo);

        Optional<AccountDetail> accountDetail =
                accountService.getAccount(accountNo);

        // Log response from the service class
        LOG.info("Details of account {}",
            accountDetail);
        ThreadContext.clearAll();
        return accountDetail.orElse(
            AccountDetail.builder().build());
    }
}
Here we have added two logger statements to print the HTTP request’s path parameter accountNo and the response from the service class.
We have also added the accountNo in a ThreadContext so that all the logs in this thread of execution will print the accountNo field. This will allow us to correlate and group requests by the accountNo field.
When we run this application and send some requests to the endpoint http://localhost:8080/accounts/5678888, we can see the logs in the console as well as in a file. In the next section, we will run this application in an Amazon EC2 instance and send the structured logs generated by the application to Amazon CloudWatch.
CloudWatch Logging Concepts: Log Events, Log Streams, and Log Groups
Before sending our logs to Amazon CloudWatch, let us understand how the logs are stored and organized in CloudWatch into Log Streams and Log Groups.
Log Event: A Log Event is an activity recorded by the application. It contains a timestamp and raw event message encoded in UTF-8.
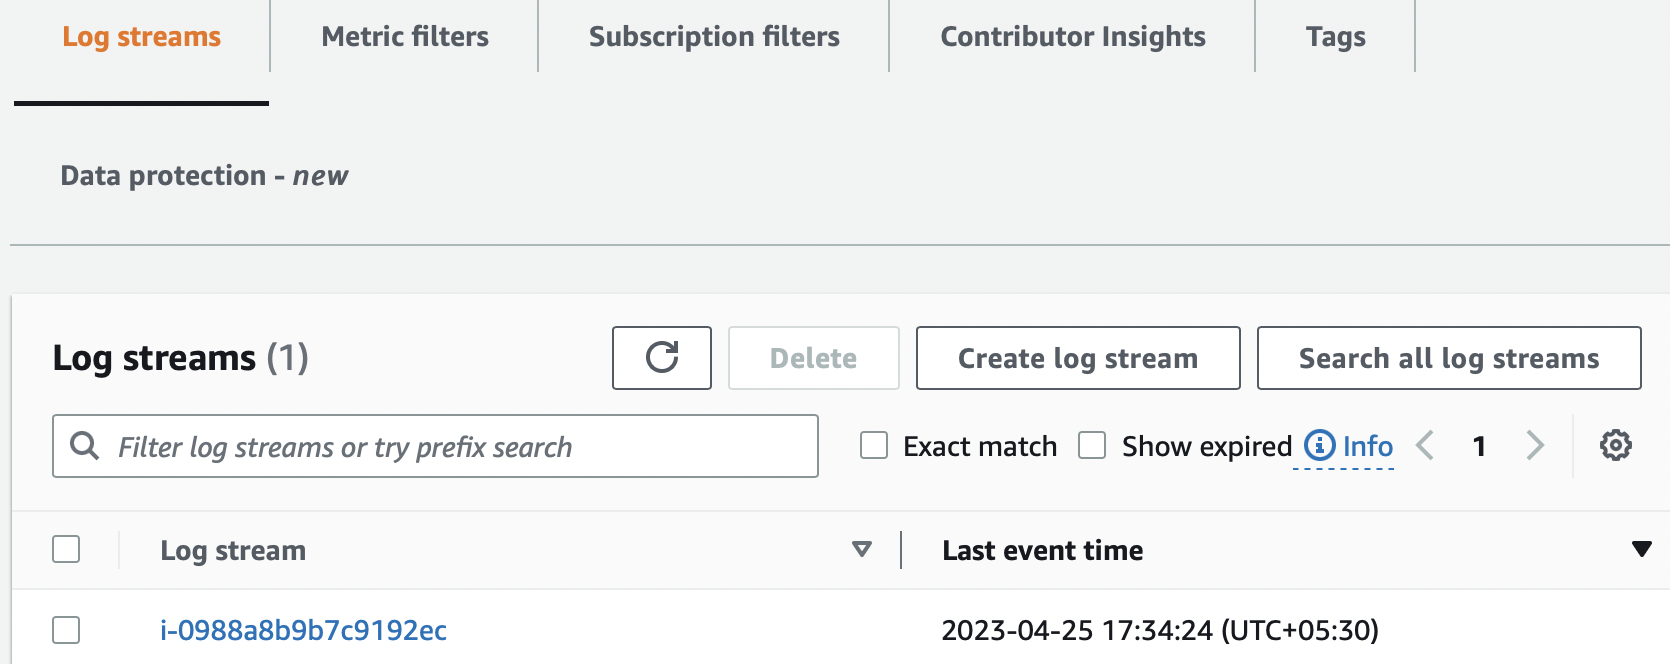
Log Streams: A log stream is a sequence of log events emitted by AWS services or any custom application. This is how a set of log streams looks in the AWS management console:
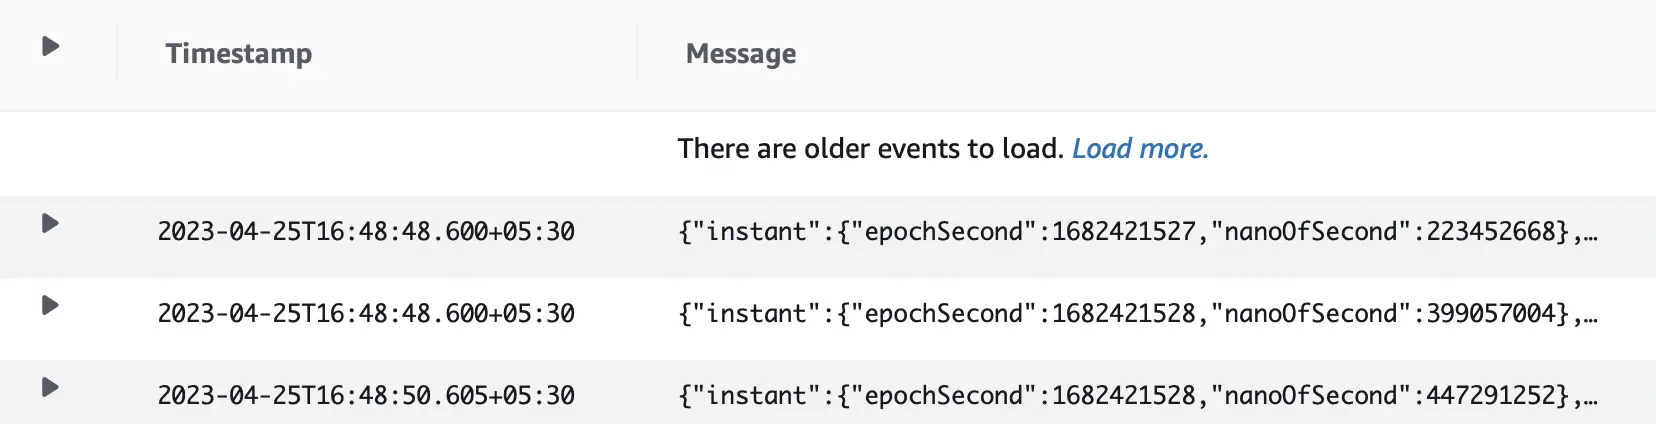
This is a snapshot of a log stream containing a sequence of log events.
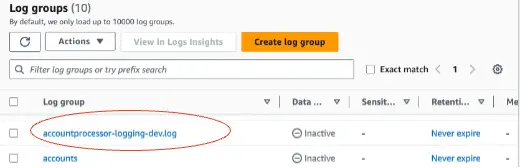
Log Groups: Log Groups are a group of Log Streams that share the same retention, monitoring, and access control settings. Each log stream belongs to one log group. A set of log groups in the AWS console is shown here:
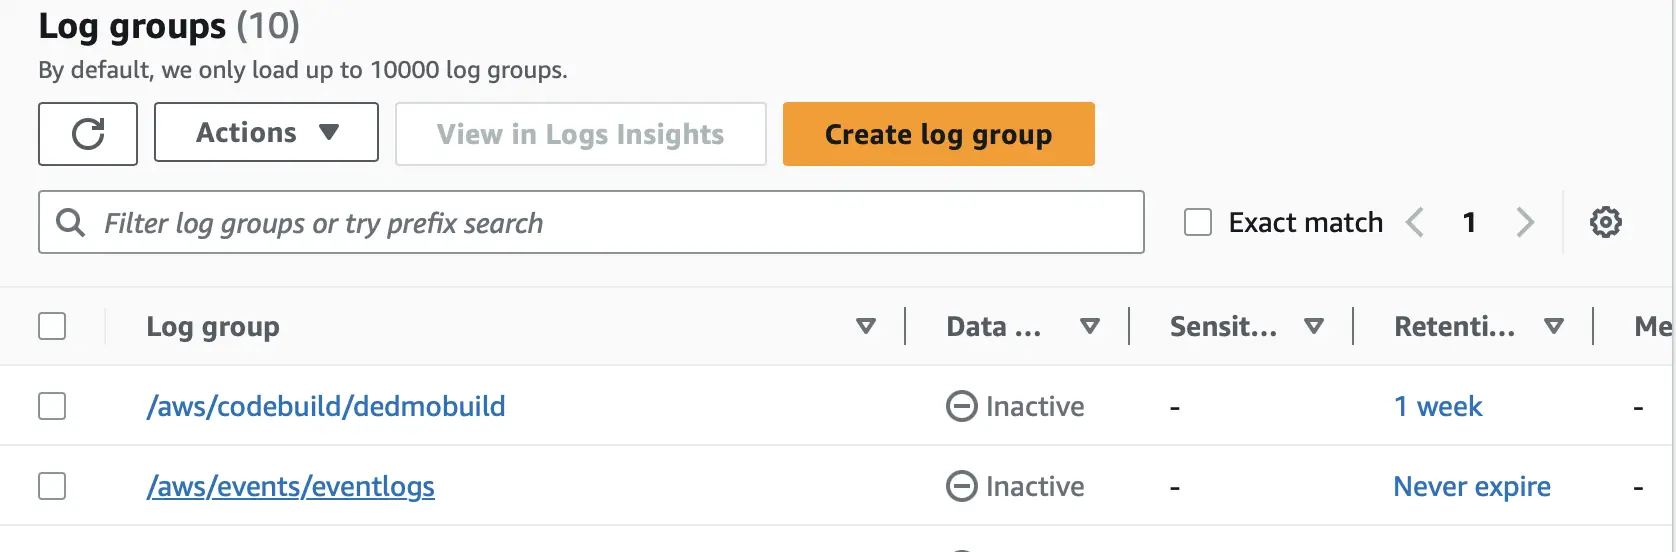
We can specify the duration for which we want the logs to be retained by specifying retention settings to the log group.
We can also assign metric filters to log groups to extract metric observations from ingested log events and transform them into data points in a CloudWatch metric.
Here we will configure a Spring Boot application to produce structured logs and then send those logs to CloudWatch.
Sending the Logs to Amazon CloudWatch from Amazon EC2 Instance
We will next run the Spring Boot application in an EC2 instance and ship our application logs to CloudWatch. We use the unified CloudWatch agent to collect logs from Amazon EC2 instances and send them to CloudWatch.
Creating EC2 Instance and Configuring it to Run the Spring Boot Application
We can either create the EC2 instance from the AWS Management Console or any of the Infrastructure as Code tools: Terraform, CloudFormation, or CDK.
For the purpose of running our example, Terraform scripts are included in the source code for creating the EC2 instance.
We also need to install OpenJDK: an open-source implementation of the Java Platform to run our Spring Boot application. After the EC2 instance starts up, we can use the following script to install OpenJDK on the EC2 instance.
wget https://download.java.net/***openjdk-20.0.1_linux-x64_bin.tar.gz
tar xvf openjdk*
export JAVA_HOME=jdk-20.0.1
export PATH=$JAVA_HOME/bin:$PATH
export CLASSPATH=.:$JAVA_HOME/lib/dt.jar:$JAVA_HOME/lib/tools.jar
We will further need to attach an IAM role with AWS Managed policy CloudWatchAgentServerPolicy to the EC2 instance which allows the EC2 instance to write logs to Amazon CloudWatch.
Running the Spring Boot Application
After configuring the EC2 instance, we will transfer the Spring Boot application from our local machine to the EC2 instance created in the previous step using SCP(Secure Copy) protocol:
scp -i tf-key-pair.pem ~/Downloads/accountProcessor/target/accountProcessor-0.0.1-SNAPSHOT.jar ec2-user@3.66.165.62:/home/ec2-user/
In this scp command, we are copying the Spring Boot application jar file: accountProcessor-0.0.1-SNAPSHOT.jar from our local machine to the EC2 instance.
We will then run this Jar file with the command:
java -jar accountProcessor-0.0.1-SNAPSHOT.jar
After the application is started we can see the application logs in the file: accountprocessor-logging-dev.log configured in the FileAppender in the log4j configuration of our application.
In the next section, we will configure the CloudWatch agent to read this file and ship the log entries to Amazon CloudWatch.
Installing and Configuring the Unified CloudWatch Agent
The Unified CloudWatch agent is available as a package in Amazon Linux 2.
Let us install the CloudWatch agent by running the yum command:
sudo yum install amazon-cloudwatch-agent
Next, we need to create a configuration file for configuring the CloudWatch agent to collect specific log files from the EC2 instance and send them to CloudWatch.
The agent configuration file is a JSON file with three sections: agent, metrics, and logs that specifies the metrics and logs which the agent needs to collect. The logs section specifies what log files are published to CloudWatch Logs.
Since our Spring Boot application is writing the log files to the path:
accountprocessor/logs/accountprocessor-logging-dev.log, we will configure this path in the logs section of our agent configuration file.
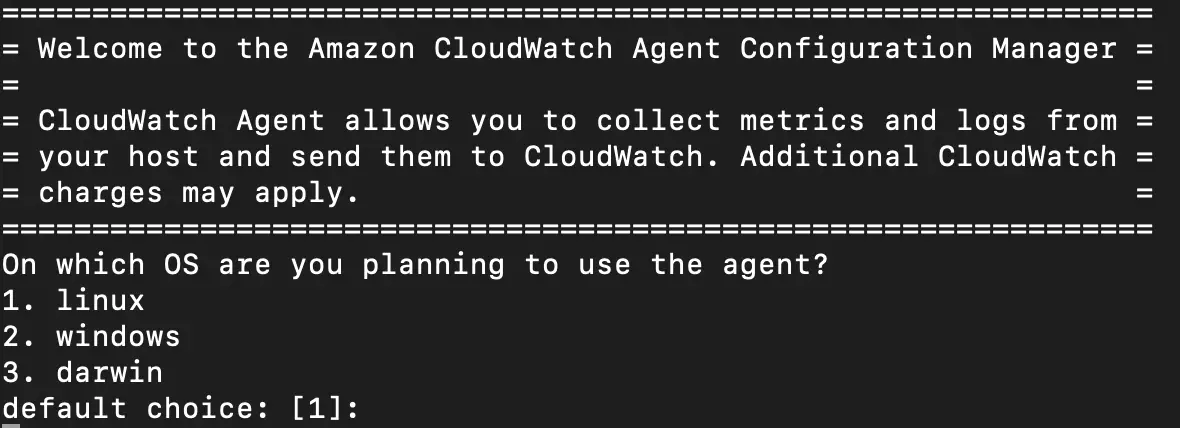
We can create the agent configuration file by using the agent configuration file wizard or by creating it manually from scratch.
Let us use the wizard to create the configuration file by starting the agent configuration file wizard using the following command:
sudo /opt/aws/amazon-cloudwatch-agent/bin/amazon-cloudwatch-agent-config-wizard
In our case we will specify the log file path in the wizard:
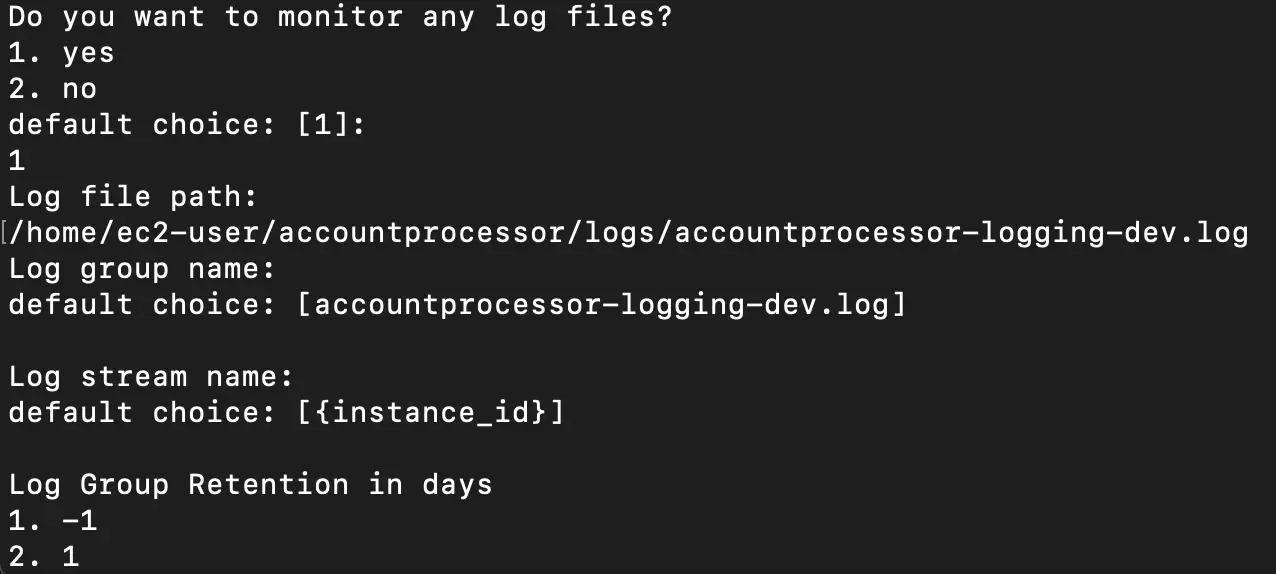
In this snapshot, we can see the file path and the names of the log group specified in the wizard.
The configuration file: config.json generated by the wizard looks like this:
{
    "agent": {
        "run_as_user": "ec2-user"
    },
    "logs": {
        "logs_collected": {
            "files": {
                "collect_list": [
                    {
                        "file_path": "/home/ec2-user/accountprocessor/logs/accountprocessor-logging-dev.log",
                        "log_group_name": "accountprocessor-logging-dev.log",
                        "log_stream_name": "{instance_id}",
                        "retention_in_days": -1
                    }
                ]
            }
        }
    }
}
We can further modify this file manually to add more file paths.
After configuring the CloudWatch agent let us start the CloudWatch agent by running the command:
sudo /opt/aws/amazon-cloudwatch-agent/bin/amazon-cloudwatch-agent-ctl -a fetch-config -m ec2 -s -c file:/opt/aws/amazon-cloudwatch-agent/bin/config.json
Once the agent is started, it will start sending the log events to Amazon CloudWatch.
Viewing the Application Logs in Amazon CloudWatch
We can now view the logs from our Spring Boot application in the Amazon CloudWatch console:
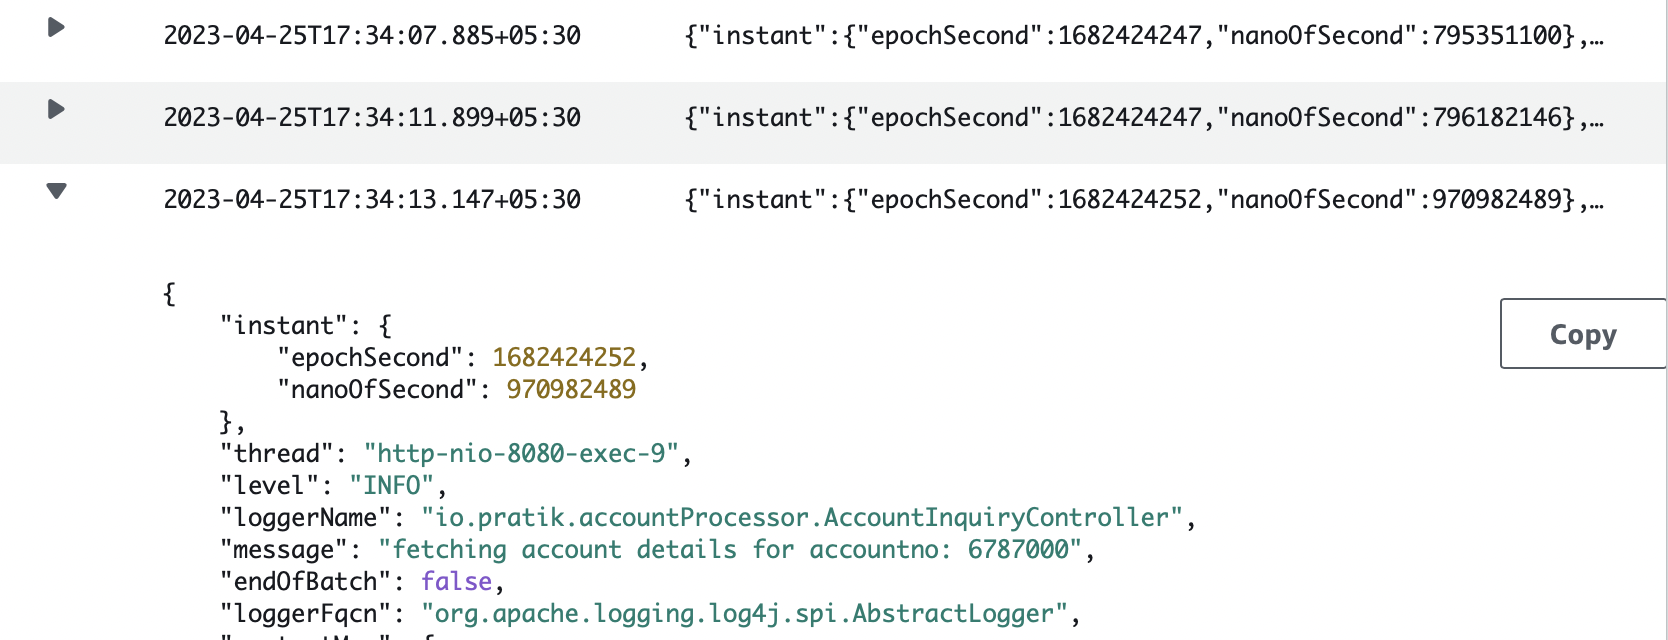
Although we are logging from a single application here, CloudWatch is commonly used as a log aggregator from multiple source applications or services. This allows us to see the logs from all sources in one place as a single and consistent flow of log events ordered by time.
Running Queries on Logs with CloudWatch Log Insights
CloudWatch Log Insights provides a User Interface and a powerful purpose-built query language to search through the ingested log data and decipher different signals to monitor our applications.
Here we are using CloudWatch Log Insights to find the number of errors that occurred in our Spring Boot application in the last 1 hour.
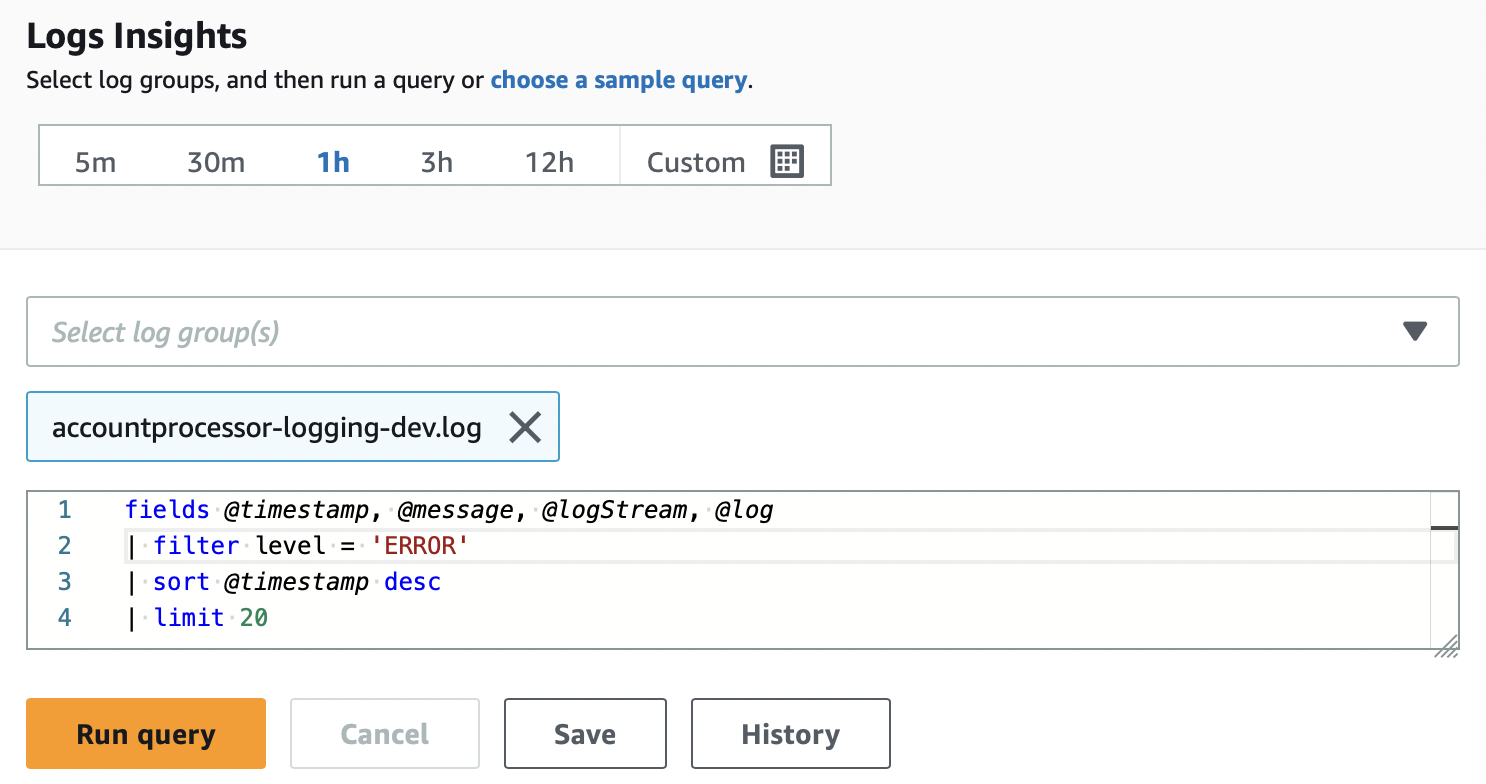
We have defined a query with a filter on level = ‘ERROR’ sorting by timestamp and limiting the results to 20. When we run the query, we get the following results:
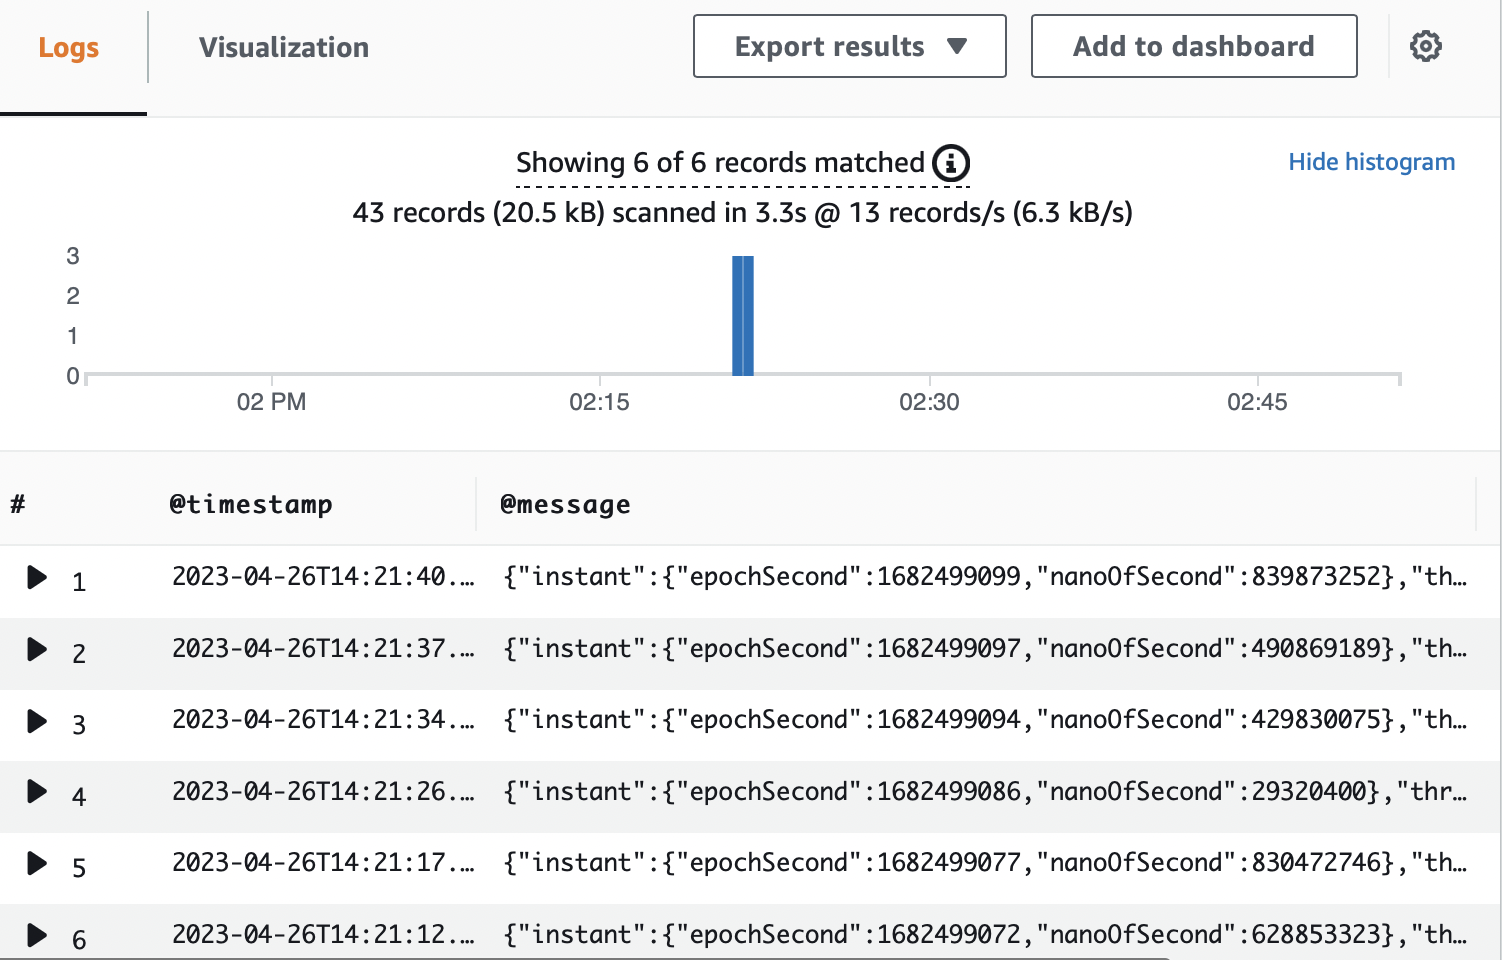
In the query results, we can see 6 errors from our application in the last 1 hour. We can define appropriate thresholds on fields like the number of errors within a defined interval to take proactive mitigating actions.
Conclusion
Here is a list of the major points for a quick reference:
- Amazon CloudWatch is a managed monitoring and logging service which is used as centralized log storage.
- Structured logging is a methodology to log information in a consistent format that allows logs to be treated as data rather than text.
- We produce structured logs in applications most often by using logging libraries in different programming languages.
- logs are stored and organized in CloudWatch into Log Streams and Log Groups.
- Log stream is a sequence of log events emitted by AWS services or any custom application.
- Log Groups are a group of Log Streams that share the same retention, monitoring, and access control settings.
- We use the unified CloudWatch agent to collect logs from Amazon EC2 instances and send them to CloudWatch.
- CloudWatch Log Insights provides a User Interface and a powerful purpose-built query language to search through log data and decipher different signals to monitor our applications.
You can refer to all the source code used in the article on Github.