Monitoring and observability are essential in distributed environments and they rely on effective health checking mechanisms that can be observed at runtime.
In this article, we will build health check functions in Spring Boot applications and make them observable by capturing useful health metrics and integrate with popular monitoring tools.
Example Code
This article is accompanied by a working code example on GitHub.Why Do we use Health Checks?
A distributed system is composed of many moving parts like a database, queues, and other services. Health check functions tell us the status of our running application like whether the service is slow or not available.
We also learn to predict the system health in the future by observing any anomalies in a series of metrics like memory utilization, errors, and disk space. This allows us to take mitigating actions like restarting instances, falling back to a redundant instance, or throttling the incoming requests.
Timely detection and proactive mitigation will ensure that the application is stable and minimize any impact on business functions.
Apart from infrastructure and operations teams, health check metrics and insights derived from them are also becoming useful to the end-users.
In an API ecosystem, for instance, with API developers, partners, and third-party developers, the health status of APIs is regularly updated and published in a dashboard, like on this Dashboard by Twitter:
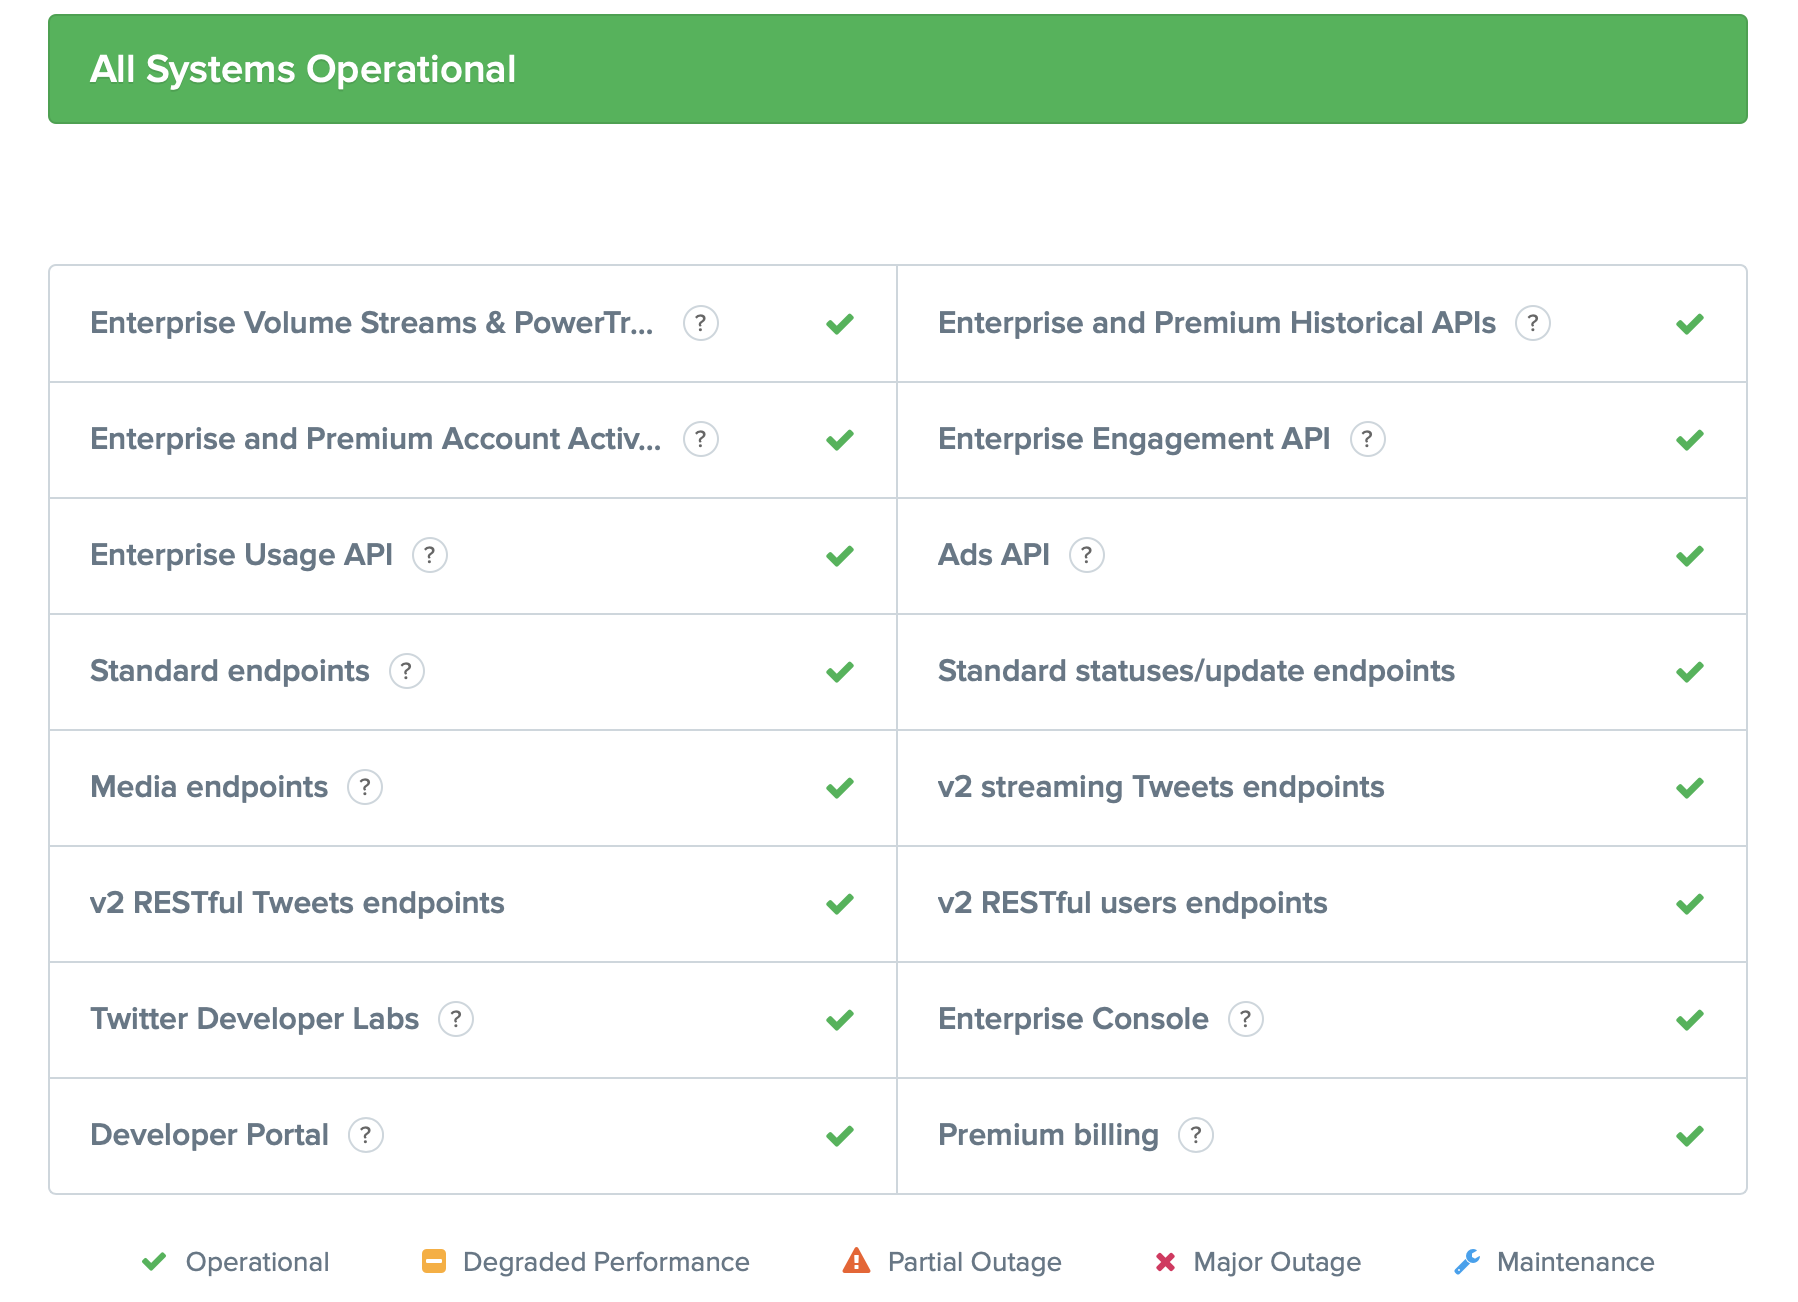
The dashboard gives a snapshot of the health status of the Twitter APIs as “Operational”, “Degraded Performance”, etc. helping us to understand the current status of those APIs.
Common Health Checking Techniques
The simplest way of implementing a health check is to periodically check the “heartbeat” of a running application by sending requests to some of its API endpoints and getting a response payload containing the health of the system.
These heartbeat endpoints are HTTP GET or HEAD requests that run light-weight processes and do not change the state of the system. The response is interpreted from either the HTTP response status or from specific fields in the response payload.
Although this method can tell us if the application itself is up and running, it does not tell us anything about the services that the application depends on like a database, or another service. So a composite health check made up of the health of dependent systems aggregated together gives a more complete view.
A composite health check is sometimes also called a “deep check”.
A more proactive approach involves monitoring a set of metrics indicating system health. These are more useful since they give us early indications of any deteriorating health of the system giving us time to take mitigating measures.
We will look at all of these approaches in the subsequent sections.
Adding a Health Check in Spring Boot
We will build a few APIs with Spring Boot and devise mechanisms to check and monitor their health.
Let us create our application with the Spring Initializr by including the dependencies for web, lombok, webflux, and actuator.
Adding the Actuator Dependency
The Actuator module provides useful insight into the Spring environment for a running application with functions for health checking and metrics gathering by exposing multiple endpoints over HTTP and JMX. We can refer to the full description of the Actuator module in the Actuator Documentation.
We added the actuator dependency while creating the application from the Initializr. We can choose to add it later in our pom.xml:
<dependency>
  <groupId>org.springframework.boot</groupId>
  <artifactId>spring-boot-starter-actuator</artifactId>
</dependency>
For gradle, we add our dependency as:
dependencies {
  compile("org.springframework.boot:spring-boot-starter-actuator")
}
Checking the Health Status with Zero Configuration
We will first build our application created above with Maven or Gradle:
mvn clean package
Running this command will generate the executable in the fat jar format containing the actuator module. Let us execute this jar with:
java -jar target/usersignup-0.0.1-SNAPSHOT.jar
We will now run the application and access the /health endpoint using curl or by hitting the URL from the browser:
curl http://localhost:8080/actuator/health
Running the curl command gives the output:
{"status":"UP"}
The status UP indicates the application is running. This is derived from an evaluation of the health of multiple components called “health indicators” in a specific order.
The status will show DOWN if any of those health indicator components are ‘unhealthy’ for example a database is not reachable.
We will look at health indicators in more detail in the following sections. However, in summary, the UP status from the Actuator health endpoint indicates that the application can operate with full functionality.
Checking Health Status Details
To view some more information about the application’s health, we will enable the property management.endpoint.health.show-details in application.properties:
# Show details of health endpoint
management.endpoint.health.show-details=always
After we compile and run the application, we get the output with details of the components contributing to the health status:
{
   "status": "UP",
   "components": {
    "diskSpace": {
     "status": "UP",
     "details": {
      "total": 250685575168,
      "free": 12073996288,
      "threshold": 10485760,
      "exists": true
     }
    },
    "ping": {
     "status": "UP"
    }
   }
}
We can see in this output that the health status contains a component named diskSpace which is UP with details containing the total, free, and threshold space. This HealthIndicator checks available disk space and will report a status of DOWN when the free space drops below the threshold space.
Aggregating Health Status from Multiple Health Indicators
Let us add some real-life flavor to our application by adding some APIs that will not only store information in a database but also read from it.
We will create three APIs in our application:
- add user
- activate user
- fetch users
These APIs will be using a controller, service, and repository class. The repository is based on JPA and uses the in-memory H2 database. The API for fetch users will also use a URL shortener service for shortening the user’s profile URL.
You can check out the code on GitHub.
Database Health Indicator
After we build and run our application as before and check the health status, we can see one additional component for the database named db included under the components key:
{
   "status": "UP",
   "components": {
    "db": {
     "status": "UP",
     "details": {
      "database": "H2",
      "validationQuery": "isValid()"
     }
    },
    "diskSpace": {
     ...
     }
    },
    "ping": {
     "status": "UP"
    }
   }
}
The health status is composed of status contributed by multiple components called “health Indicators” in the Actuator vocabulary.
In our case, the health status is composed of health indicators of disk space and database.
The database health indicator is automatically added by Spring Boot if it detects a Datasource as we will see in the next section.
Other Predefined Health Indicators
Spring Boot Actuator comes with several predefined health indicators like
DataSourceHealthIndicator,MongoHealthIndicator,RedisHealthIndicator, orCassandraHealthIndicator.
Each of them is a Spring bean that implements the HealthIndicator interface and checks the health of that component.
Spring Boot automatically provides a health indicator for standard components (like a DataSource). The health check provided by a DataSource creates a connection to a database and performs a simple query, such as select 1 from dual to check that it is working.
Aggregating Health Indicators
Spring Boot aggregates all health indicators it finds in the application context to create the result of the /health endpoint we have seen above.
If our application uses Redis, a Redis component is added to the endpoint. If we use MongoDB, a MongoDB component is added to the endpoint. And so on.
The aggregation is done by an implementation of StatusHealthAggregator which aggregates the statuses from all health indicators into a single overall status.
Spring Boot auto-configures an instance of SimpleHealthAggregator. We can provide our own implementation of StatusHealthAggregator to supersede the default behavior.
We can also disable a particular health indicator using application properties:
management.health.mongo.enabled=false
Checking the Health of APIs with Custom Health Indicators
Predefined health indicators do not cover all use cases of a health check.
For example, if our API is dependent on any external service, we might like to know if the external service is available. Further, we might like to know the health of the individual APIs rather than the health of the entire application.
For this, we will now build two types of custom health checks in our application:
- a health check for individual components with health indicators
- a composite health check with composite health contributors
Checking the Health of Individual Components
In our example, we are using an external service for shortening the URLs. We will monitor the availability of this service by building a health indicator of this service.
Creating a custom health indicator is done in two steps:
- Implement the
HealthIndicatorinterface and override thehealth()method. - Register the health indicator class as a Spring bean by adding the
@Componentannotation (or by using Java Config).
Our custom health indicator for the UrlShortener Service looks like this:
@Component
@Slf4j
public class UrlShortenerServiceHealthIndicator
    implements HealthIndicator {

  private static final String URL
    = "https://cleanuri.com/api/v1/shorten";

  @Override
  public Health health() {
    // check if url shortener service url is reachable
    try (Socket socket =
        new Socket(new java.net.URL(URL).getHost(),80)) {
    } catch (Exception e) {
      log.warn("Failed to connect to: {}",URL);
      return Health.down()
        .withDetail("error", e.getMessage())
        .build();
    }
    return Health.up().build();
  }

}
In this class, we return the status as UP if the URL is reachable, otherwise, we return the DOWN status with an error message.
Composite Health Checking with Health Contributors
Earlier, we added three APIs to our application for adding, activating, and fetching users. It will be very useful to see the health of the individual APIs by checking specific resources on a per-endpoint basis. We will do this with CompositeHealthContributors.
Our Fetch Users API depends on the database and the URL shortener service. This API can function only if both of these dependencies are available. We can do this in a single health indicator as described in the previous section.
But this can be done more elegantly with a CompositeHealthContributor which will combine the health checks from the database and the URL shortener service. The steps for building a composite health check are:
- Implement the
CompositeHealthContributorinterface in a Spring bean. - Mark the contributing health indicators with the
HealthContributorinterface. - Override the
iterator()method in theCompositeHealthContributorinterface with the list of health contributors which are health indicators marked with theHealthContributorinterface.
For our example, we will first create a database health indicator and mark it with the HealthContributor interface:
@Component("Database")
public class DatabaseHealthContributor
    implements HealthIndicator, HealthContributor {

  @Autowired
  private DataSource ds;

  @Override
  public Health health() {
    try(Connection conn = ds.getConnection()){
      Statement stmt = conn.createStatement();
      stmt.execute("select FIRST_NAME,LAST_NAME,MOBILE,EMAIL from USERS");
    } catch (SQLException ex) {
      return Health.outOfService().withException(ex).build();
    }
    return Health.up().build();
  }
}
For checking the health status of the database we execute a query on the USERS table used in the Fetch Users API.
We will next mark the URL shortener health indicator we created in the previous section with the HealthContributor interface:
public class UrlShortenerServiceHealthIndicator
    implements HealthIndicator, HealthContributor {
...
}
We will now create the composite health check of our Fetch Users API using the two health contributor components we created above:
@Component("FetchUsersAPI")
public class FetchUsersAPIHealthContributor
    implements CompositeHealthContributor {

  private Map<String, HealthContributor>
          contributors = new LinkedHashMap<>();

  @Autowired
  public FetchUsersAPIHealthContributor(
      UrlShortenerServiceHealthIndicator
              urlShortenerServiceHealthContributor,
      DatabaseHealthContributor
              databaseHealthContributor) {

    contributors.put("urlShortener",
        urlShortenerServiceHealthContributor);

    contributors.put("database",
        databaseHealthContributor);
  }

  /**
   *  return list of health contributors
   */
  @Override
  public Iterator<NamedContributor<HealthContributor>> iterator() {
    return contributors.entrySet().stream()
       .map((entry) ->
          NamedContributor.of(entry.getKey(),
              entry.getValue())).iterator();
  }

  @Override
  public HealthContributor getContributor(String name) {
    return contributors.get(name);
  }

}
The FetchUsersAPIHealthContributor class will publish the health status of Fetch Users API as UP if:
- the URL shortener service is reachable, and
- we can run SQL queries on the USERS table used in the API.
With this health indicator of the API added, our health check output now contains the health status of FetchUsers API in the list of components.
"FetchUsersAPI": {
   "status": "UP",
   "components": {
      "database": {
         "status": "UP"
      },
      "urlShortener": {
         "status": "UP"
      }
   }
},
...
}
The corresponding error output appears when we introduce an error by specifying a non-existent table:
"FetchUsersAPI": {
   "status": "OUT_OF_SERVICE",
   "components": {
      "database": {
         "status": "OUT_OF_SERVICE",
         "details": {
            "error": "..."
         }
      },
      "urlShortener": {
         "status": "UP"
      }
   }
},
This output indicates that the Fetch Users API is out-of-service and cannot serve requests when the database is not set up although the URL shortener service is available.
Health Indicators can also be grouped for specific purposes. For example, we can have a group for database health and another for the health of our caches.
Monitoring Application Health
We monitor the health of our application by observing a set of metrics. We will enable the metrics endpoint to get many useful metrics like JVM memory consumed, CPU usage, open files, and many more.
Micrometer is a library for collecting metrics from JVM-based applications and converting them in a format accepted by the monitoring tools. It is a facade between application metrics and the metrics infrastructure developed by different monitoring systems like Prometheus, New Relic, and many others.
To illustrate, we will integrate our Spring Boot application with one of these monitoring systems - Prometheus. Prometheus operates on a pull model by scraping metrics from an endpoint exposed by the application instances at fixed intervals.
We will first add the micrometer SDK for Prometheus:
<dependency>
  <groupId>io.micrometer</groupId>
  <artifactId>micrometer-registry-prometheus</artifactId>
</dependency>
We can integrate with another monitoring system like New Relic similarly by adding micrometer-registry-newrelic dependency for metric collection. New Relic in contrast to Prometheus works on a push model so we need to additionally configure credentials for New Relic in the Spring Boot application.
Continuing with our example with Prometheus, we will expose the Prometheus endpoint by updating the management.endpoints.web.exposure.include property in our application.properties.
management.endpoints.web.exposure.include=health,info,prometheus
Here is a snippet of the metrics from the prometheus endpoint - http://localhost:8080/actuator/prometheus:
jvm_threads_daemon_threads 23.0
jvm_buffer_count_buffers{id="mapped - 'non-volatile memory'",} 0.0
jvm_buffer_count_buffers{id="mapped",} 0.0
jvm_buffer_count_buffers{id="direct",} 14.0
process_files_open_files 33.0
hikaricp_connections_max{pool="HikariPool-1",} 10.0
...
Next, we will add the job in Prometheus with the configuration for scraping the above metrics emitted from our application. This configuration will be saved in prometheus-config.yml.
  - job_name: 'user sign up'
  metrics_path: '/actuator/prometheus'
  scrape_interval: 5s
  static_configs:
  - targets: ['<HOST_NAME>:8080']
This configuration will scrape the metrics at 5-second intervals.
We will use Docker to run Prometheus. Specify the IP address of the host machine instead of localhost while running in Docker:
docker run \
-p 9090:9090 \
-v prometheus-config.yml:/etc/prometheus/prometheus.yml \
prom/prometheus
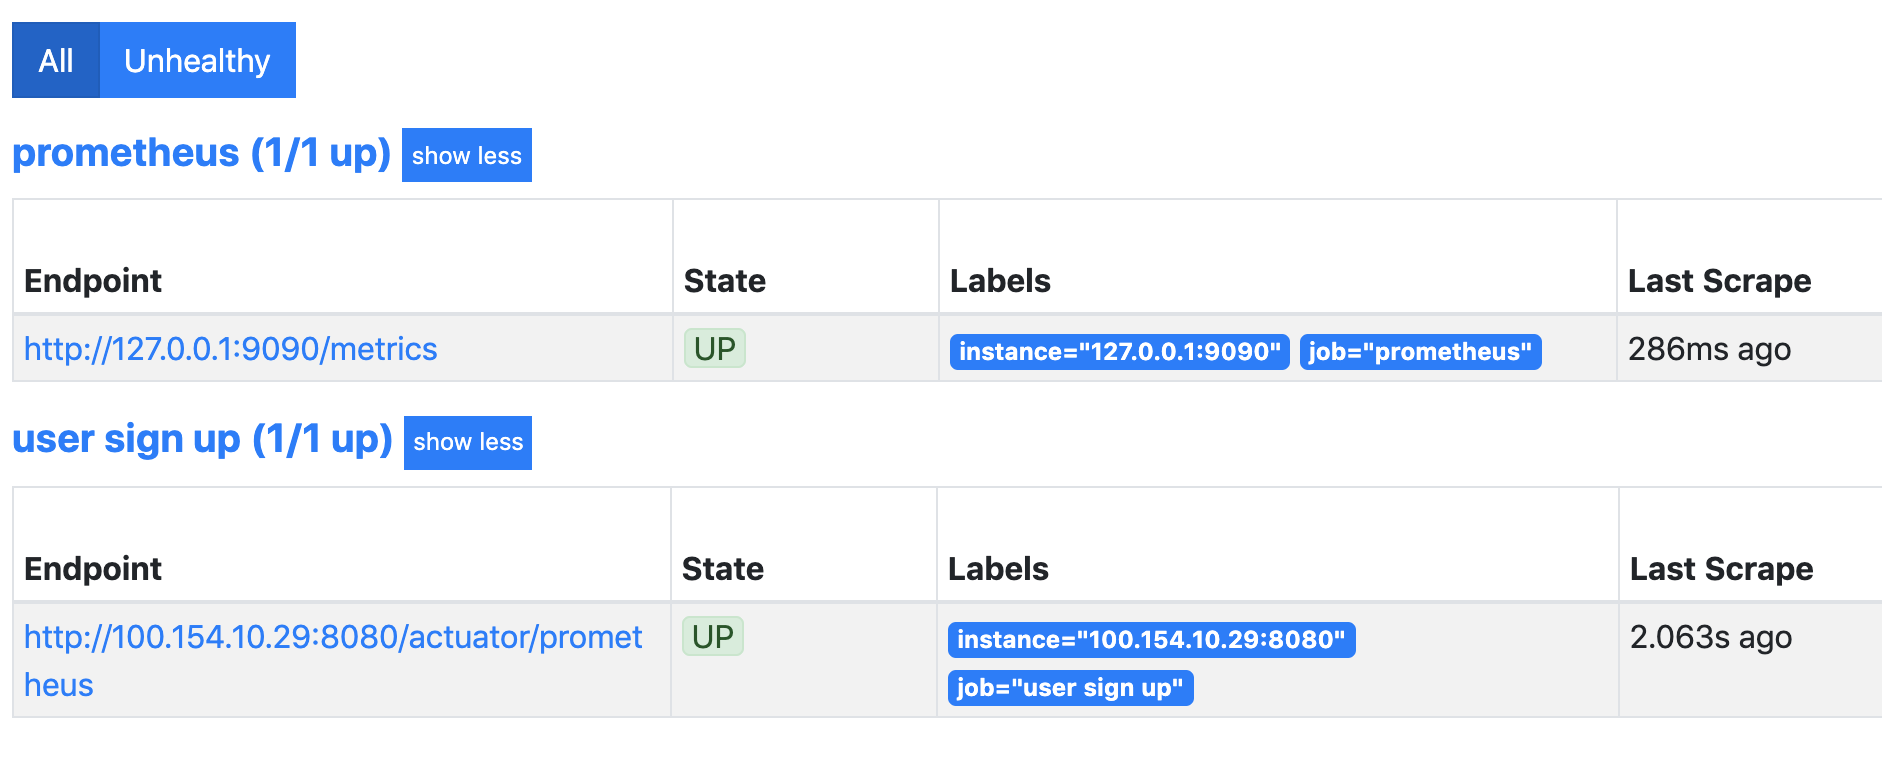
Now we can check our application as a target in Prometheus by visiting the URL - http://localhost:9090/targets:
As stated above, due to the Micrometer metrics facade we can integrate with other monitoring tools only by adding the provider-specific Micrometer dependency to the application.
Configuring Kubernetes Probes
Microservices built with Spring Boot are commonly packaged in containers and deployed to container orchestration systems like Kubernetes. One of the key features of Kubernetes is self-healing, which it does by regularly checking the health of the application and replacing unhealthy instances with healthy instances.
Among its many components, the Kubelet ensures that the containers are running and replaced with a healthy instance, anytime it goes down. This is detected using two properties:
- Liveness Check: An endpoint indicating that the application is available. The Kubelet uses liveness probes to know when to restart a container.
- Readiness Check: The Kubelet uses readiness probes to know when a container is ready to start accepting traffic.
We will enable these two health checks by setting the property in application.properties.
management.health.probes.enabled=true
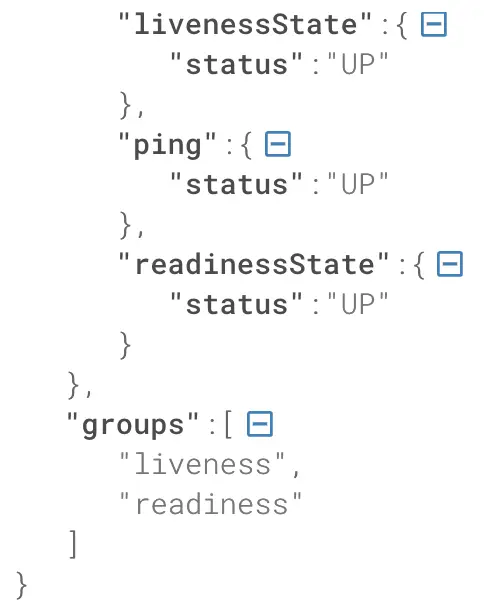
After this when we compile and run the application, we can see these two health checks in the output of the health endpoint and also two health groups.
We can next use these two endpoints to configure HTTP probes for liveness and readiness checks in the container specification when creating the deployment object in Kubernetes. This definition of Deployment object along with the Service object is saved in deployment.yaml:
livenessProbe:
  httpGet:
    path: /actuator/health/liveness
    port: 8080
readinessProbe:
  httpGet:
    path: /actuator/health/readiness
    port: 8080
We will create these objects in Kubernetes by running
kubectl apply -f deployment.yaml
For the HTTP probe, the Kubelet process sends an HTTP request to the specified path and port to perform the liveness and readiness checks.
Conclusion
We saw how we can build powerful monitoring and observability capabilities in Spring Boot applications with the help of the Actuator module. We configured health indicators and Kubernetes probes in a microservice application and enabled health check metrics to integrate with monitoring tools like Prometheus.
Observability is a rapidly evolving area and we should expect to see more features along these lines in future releases of Spring Boot.
You can refer to all the source code used in the article on Github.