Metrics provide a quantifiable measure of specific attributes of an application. A collection of different metrics give intelligent insights into the health and performance of an application.
Amazon CloudWatch is a monitoring and observability service in the AWS cloud platform. One of its main features is collecting metrics and storing the metrics in a time-series database.
In this article, we will generate different types of application metrics in a Spring Boot web application and send those metrics to Amazon CloudWatch.
Amazon CloudWatch will store the metrics data and help us to derive insights about our application by visualizing the metric data in graphs.
Check Out the Book!
This article gives only a first impression of what you can do with Amazon CloudWatch.
If you want to go deeper and learn how to deploy a Spring Boot application to the AWS cloud and how to connect it to cloud services like RDS, Cognito, and SQS, make sure to check out the book Stratospheric - From Zero to Production with Spring Boot and AWS!
Example Code
This article is accompanied by a working code example on GitHub.What is Amazon CloudWatch?
Amazon CloudWatch is a dimensional time-series service in the AWS cloud platform. It provides the following features:
- Collecting and monitoring logs.
- Storing metrics from AWS resources, and applications running in AWS or outside AWS.
- Providing system-wide visualization with graphs and statistics.
- Creating alarms that watch a single or multiple CloudWatch metrics and perform some actions based on the value of the metric.
We will use only the metrics storing and visualization capability of CloudWatch here for the metrics generated by a Spring Boot application.
Hence it will be worthwhile to introduce a few concepts important for creating the metrics in our application:
Metric: Metric is a fundamental concept in CloudWatch. It is associated with one or more measures of any application attribute at any point in time and is represented by a series of data points with a timestamp.
Namespace: A namespace is a container for CloudWatch metrics. We specify a namespace for each data point published to CloudWatch.
Dimension: A dimension is a name/value pair that is part of the identity of a metric. We can assign up to 10 dimensions to a metric.
Metrics are uniquely defined by a name, a namespace, and zero or more dimensions. Each data point in a metric has a timestamp, and optionally a unit of measure.
When we choose CloudWatch to monitor our application, then the data about certain attributes of the application is sent to CloudWatch as a data point for a metric at regular intervals.
Please refer to the official documentation or the Stratospheric book for a more elaborate explanation of Amazon CloudWatch concepts and capabilities.
In the subsequent sections, we will create a Spring Boot application, generate some metrics in the application, and ship them to Amazon CloudWatch. After the metrics are published in CloudWatch, we will visualize them using CloudWatch graphs.
An Example Application for Capturing Metrics
With this basic understanding of Amazon CloudWatch, let us now create a web application with the Spring Boot framework for creating our metrics.
Let us first create a Spring Boot project with the help of the Spring boot Initializr, and then open the project in our favorite IDE. We have added dependencies on the web and lombok modules in our Maven pom.xml.
Our web application will have a REST API for fetching products in an online shopping application.
We have created our API in the following class using the annotations from the Spring Web dependency:
@RestController
@Slf4j
public class ProductController {

  @GetMapping("/products")
  @ResponseBody
  public List<Product> fetchProducts() {

    List<Product> products = fetchProductsFromStore();

    return products;
  }

  /**
   * Dummy method to fetch products from any datastore
   *
   */
  private List<Product> fetchProductsFromStore(){
    List<Product> products = new ArrayList<Product>();
    products.add(Product.builder().name("Television").build());
    products.add(Product.builder().name("Book").build());
    return products;
  }

}
The fetch products API is created with the fetchProducts() method in this ProductController class will accept HTTP GET requests at http://localhost:8080/products and respond with a JSON representation of a list of products.
In the next sections, we will enrich this application to capture three metrics with a specific purpose:
- Measure the number of HTTP requests for the fetch products API.
- Track the fluctuation in the price of a product.
- Total execution time of the fetch products API.
Publishing Metrics with the CloudWatch SDK
The simplest way for an application to send metrics to CloudWatch is by using the AWS Java SDK. The below code shows a service class for sending metrics to CloudWatch using AWS Java SDK:
@Configuration
public class AppConfig {
  @Bean
  public CloudWatchAsyncClient cloudWatchAsyncClient() {
    return CloudWatchAsyncClient
           .builder()
           .region(Region.US_EAST_1)
           .credentialsProvider(
             ProfileCredentialsProvider
             .create("pratikpoc"))
           .build();
  }
}

@Service
public class MetricPublisher {

  private CloudWatchAsyncClient cloudWatchAsyncClient;

  @Autowired
  public MetricPublisher(CloudWatchAsyncClient cloudWatchAsyncClient) {
    super();
    this.cloudWatchAsyncClient = cloudWatchAsyncClient;
  }

  public void putMetricData(final String nameSpace,
            final String metricName,
            final Double dataPoint,
            final List<MetricTag> metricTags) {

    try {

      List<Dimension> dimensions = metricTags
          .stream()
          .map((metricTag)->{
                 return Dimension
                   .builder()
                   .name(metricTag.getName())
                   .value(metricTag.getValue())
                   .build();
      }).collect(Collectors.toList());

      // Set an Instant object
      String time = ZonedDateTime
                 .now(ZoneOffset.UTC)
                 .format(DateTimeFormatter.ISO_INSTANT);
      Instant instant = Instant.parse(time);

      MetricDatum datum = MetricDatum
               .builder()
               .metricName(metricName)
               .unit(StandardUnit.NONE)
               .value(dataPoint)
               .timestamp(instant)
               .dimensions(dimensions)
               .build();

      PutMetricDataRequest request =
                 PutMetricDataRequest
                 .builder()
                 .namespace(nameSpace)
                 .metricData(datum)
                 .build();

      cloudWatchAsyncClient.putMetricData(request);

    } catch (CloudWatchException e) {
       System.err.println(e.awsErrorDetails().errorMessage());
    }
  }
}

public class MetricTag {
  private String name;
  private String value;
  public MetricTag(String name, String value) {
    super();
    this.name = name;
    this.value = value;
  }
  // Getters
  ...
  ...
}
In this code snippet, we are establishing the connection to Amazon CloudWatch by setting up the CloudWatchAsyncClient with our AWS profile credentials. The request for sending the metric is created in the putMetricData() method.
The metric is created by specifying the name of the metric, and the namespace under which the metrics will be created along with one or more tags associated with the metric called dimensions.
Publishing Metrics with Micrometer
We will make use of the Micrometer library, instead of the AWS Java SDK, to create our metrics and send them to Amazon CloudWatch.
Micrometer acts as a facade to different monitoring systems by providing a tool-agnostic interface for collecting metrics from our application and publishing the metrics to our target metrics collector:
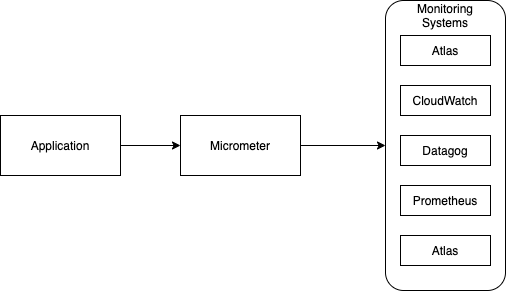
This enables us to support multiple metrics collectors and switch between them with minimal configuration changes.
Micrometer MeterRegistry and Meters
MeterRegistry and Meter are the two central concepts in Micrometer. A Meter is the interface for collecting metrics about an application. Meters in Micrometer are created from and held in a MeterRegistry. A sample code for instantiating a MeterRegistry will look like this:
MeterRegistry registry = new SimpleMeterRegistry();
SimpleMeterRegistry is a default implementation of MeterRegistry bundled with Micrometer. It holds the latest value of each meter in memory and does not export the data to any metrics collector. The diagram here shows the hierarchy and relationships of important classes and interfaces of the Micrometer.
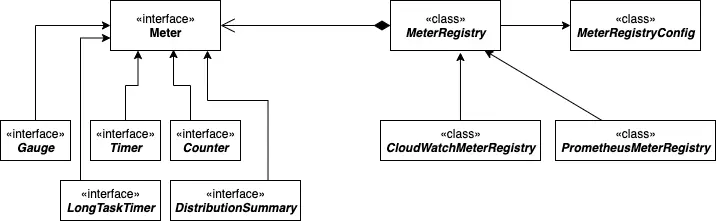
We can see different types of Meters and MeterRegistries in this diagram.
MeterRegistry represents the monitoring system where we want to push the metrics for storage and visualization.
Each supported monitoring system has an implementation of MeterRegistry. For example, for sending metrics to Amazon CloudWatch we will use CloudWatchMeterRegistry.
Each meter type gets converted into one or more metrics in a format compatible with the target monitoring system like Amazon CloudWatch in our application.
Micrometer comes with the following set of Meters:
Timer,Counter,Gauge,DistributionSummary,LongTaskTimer,FunctionCounter,FunctionTimer, andTimeGauge.
From these, we will use Timer, Counter, Gauge in our application.
Let us understand the kind of measures they can be typically used for:
-
Counter: Counter is used to measure numerical values which only increase. They can be used to count requests served, tasks completed, errors that occurred, etc.
-
Gauge: A Gauge represents a numerical value that can both increase and decrease. Gauge is used to measure values like current CPU usage, cache size, the number of messages in a queue, etc.
-
Timer: Timer is used for measuring short-duration latencies, and the frequency of such events. All implementations of
Timerreport at least the total time and count of events as separate time series.
Spring Boot Integration with Micrometer
Coming back to our application, we will first integrate Micrometer with our Spring Boot application to produce these metrics. We do this by first adding a dependency on Micrometer core library named micrometer-core :
    <dependency>
      <groupId>io.micrometer</groupId>
      <artifactId>micrometer-core</artifactId>
    </dependency>
This library provides classes for creating the meters and pushing the metrics to the target monitoring system.
We next add the dependency for the target monitoring system. We are using Amazon CloudWatch so we will add a dependency to micrometer-registry-cloudwatch2 module in our project:
    <dependency>
        <groupId>io.micrometer</groupId>
        <artifactId>micrometer-registry-cloudwatch2</artifactId>
    </dependency>
This module uses the AWS Java SDK version 2 to integrate with Amazon CloudWatch. An earlier version of the module named micrometer-registry-cloudwatch uses the AWS Java SDK version 1. Version 2 is the recommended version to use.
This library does the transformation from Micrometer meters to the format of the target monitoring system. Here the micrometer-registry-cloudwatch2 library converts Micrometer meters to CloudWatch metrics.
Creating the MeterRegistry
We will now create the MeterRegistry implementation for Amazon CloudWatch to create our Meters and push the metrics to Amazon CloudWatch. We do this in a Spring configuration class as shown here:
@Configuration
public class AppConfig {


  @Bean
  public CloudWatchAsyncClient cloudWatchAsyncClient() {
    return CloudWatchAsyncClient
        .builder()
        .region(Region.US_EAST_1)
        .credentialsProvider(
          ProfileCredentialsProvider
          .create("pratikpoc"))
        .build();
  }

  @Bean
  public MeterRegistry getMeterRegistry() {
    CloudWatchConfig cloudWatchConfig = setupCloudWatchConfig();

    CloudWatchMeterRegistry cloudWatchMeterRegistry =
        new CloudWatchMeterRegistry(
                cloudWatchConfig,
                Clock.SYSTEM,
                cloudWatchAsyncClient());

    return cloudWatchMeterRegistry;
  }

  private CloudWatchConfig setupCloudWatchConfig() {
    CloudWatchConfig cloudWatchConfig = new CloudWatchConfig() {

      private Map<String, String> configuration = Map.of(
              "cloudwatch.namespace", "productsApp",
              "cloudwatch.step", Duration.ofMinutes(1).toString());

      @Override
      public String get(String key) {
        return configuration.get(key);
      }
    };
    return cloudWatchConfig;
  }

}
In this code snippet, we have defined CloudWatchMeterRegistry as a Spring bean. For creating our registry we are first creating a new CloudWatchConfig which is initialized with two configuration properties: cloudwatch.namespace and cloudwatch.step so that it publishes all metrics to the productsApp namespace every minute.
After configuring the MeterRegistry, we will look at how we register and update our meters in the next sections.
We will register three meters:
- Counter to measure the count of views of the product list page.
- Gauge to track the price of a product
- Timer to record time of execution of
fetchProducts()method.
Registering and Incrementing a Counter
We want to count the number of views of the products list page in our application. We do this by updating the meter of type counter since this measure always goes up. In our application we register the counter for page views in the constructor and increment the counter when the API is invoked as shown in the code snippet below:
@RestController
@Slf4j
public class ProductController {
  private Counter pageViewsCounter;

  private MeterRegistry meterRegistry;

  @Autowired
  ProductController(MeterRegistry meterRegistry,
                    PricingEngine pricingEngine){

     this.meterRegistry = meterRegistry;

     pageViewsCounter = meterRegistry
         .counter("PAGE_VIEWS.ProductList");
  }

  @GetMapping("/products")
  @ResponseBody
  public List<Product> fetchProducts() {
    long startTime = System.currentTimeMillis();

    List<Product> products = fetchProductsFromStore();

    // increment page views counter
    pageViewsCounter.increment();

    return products;
  }

  private List<Product> fetchProductsFromStore(){
    List<Product> products = new ArrayList<Product>();
    products.add(Product.builder().name("Television").build());
    products.add(Product.builder().name("Book").build());
    return products;
  }
}
Here we are registering the meter of type counter by calling the counter method on our CloudWatchRegistry object created in the previous section. This method is accepting the name of the meter as a parameter.
Registering and Recording a Timer
Now we want to record the time taken to execute the API for fetching products. This is a measure of short duration latency so we will make use of a meter of type Timer.
We will register the Timer by calling the Timer static method on the registry object in the constructor of our controller class as shown here:
@RestController
@Slf4j
public class ProductController {
  private Timer productTimer;
  private MeterRegistry meterRegistry;

  @Autowired
  ProductController(MeterRegistry meterRegistry,
                    PricingEngine pricingEngine){

     this.meterRegistry = meterRegistry;
     productTimer = meterRegistry
         .timer("execution.time.fetchProducts");
  }


  @GetMapping("/products")
  @ResponseBody
  public List<Product> fetchProducts() {
    long startTime = System.currentTimeMillis();

    List<Product> products = fetchProductsFromStore();

    // record time to execute the method
    productTimer.record(Duration
      .ofMillis(System.currentTimeMillis()
                - startTime));

    return products;
  }

  private List<Product> fetchProductsFromStore(){
    List<Product> products = new ArrayList<Product>();
    // Fetch products from database or external API
    return products;
  }
}
We have set the name of the Timer as execution.time.fetchProducts when registering in the constructor. In the fetchProducts method body we record the execution time by calling the record() method.
Registering and Updating a Gauge
We will next register a meter of type Gauge to track the price of a product. For our example, we are using a fictitious pricing engine to compute the price at regular intervals. We have used a simple Java method for the pricing engine but in real life, it could be a sophisticated rules-based component. The price can go up and down so Gauge is an appropriate meter to track this measure.
We are constructing the Gauge using the fluent builder interface of the Gauge as shown below:
@RestController
@Slf4j
public class ProductController {
  private Gauge priceGauge;

  private MeterRegistry meterRegistry;

  private PricingEngine pricingEngine;

  @Autowired
  ProductController(MeterRegistry meterRegistry,
                    PricingEngine pricingEngine){

     this.meterRegistry = meterRegistry;
     this.pricingEngine = pricingEngine;

     priceGauge = Gauge
            .builder("product.price", pricingEngine ,
               (pe)->{
                   return pe != null?
                      pe.getProductPrice() : null;}
                )
            .description("Product price")
            .baseUnit("ms")
            .register(meterRegistry);
  }

 ...
 ...

}

@Service
public class PricingEngine {

  private Double price;

  public Double getProductPrice() {
    return price;
  }

  @Scheduled(fixedRate = 70000)
  public void computePrice() {

    Random random = new Random();
    price = random.nextDouble() * 100;

  }

}
As we can see in this code snippet, the price is computed every 70000 milliseconds specified by the Scheduled annotation over the computePrice() method.
We have already set up the gauge during registration to track the price automatically by specifying the function getProductPrice.
Visualizing the Metrics in CloudWatch
Let us open the AWS CloudWatch console to see the metrics we published in CloudWatch. Our metrics will be grouped under the namespace productApp which we had configured in our application when generating the metrics.
The namespace we have used to create our metrics appears under the custom namespaces section as can be seen in this screenshot:
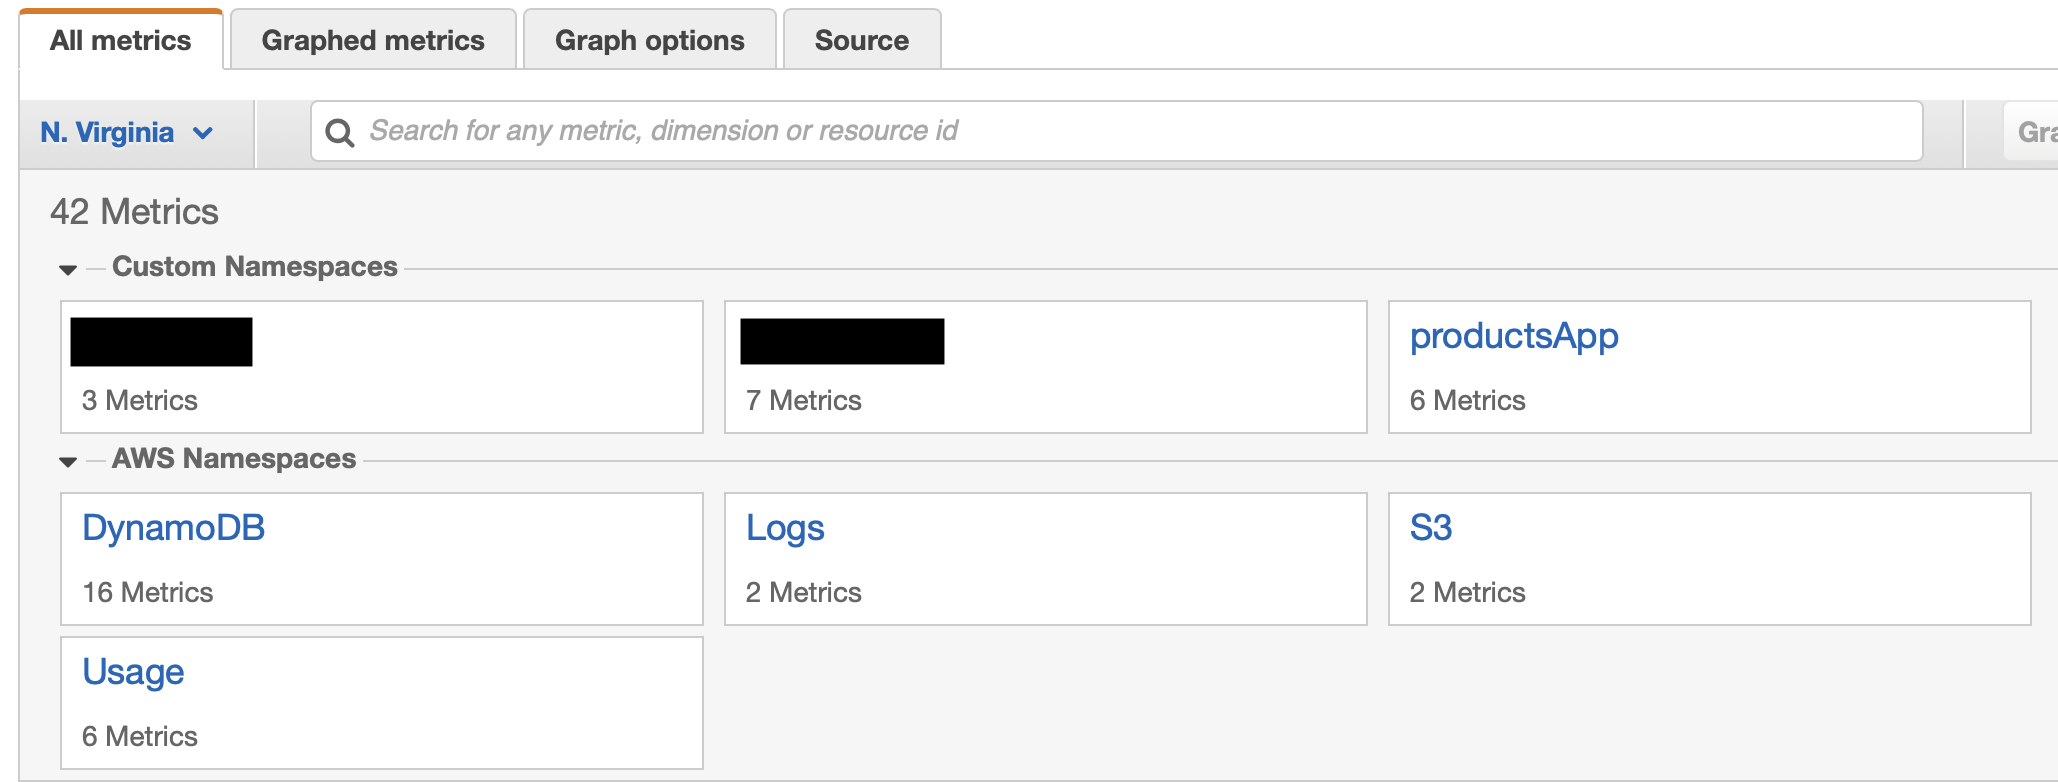
Here we can see our namespace productApp containing 6 metrics. Let us get inside the namespace to see the list of metrics as shown below:
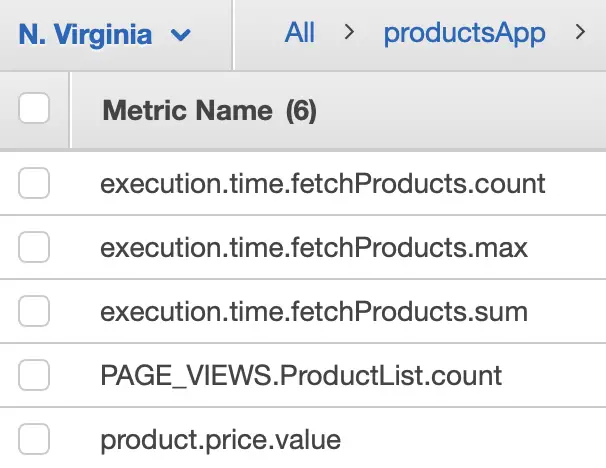
These are the metrics for each of the meters (Counter, Timer, and Gauge) of Micrometer which we had registered and updated in the application in the earlier sections:
| Micrometer Meter | Meter Type | CloudWatch Metric |
|---|---|---|
| product.price | Gauge | product.price.value |
| PAGE_VIEWS.ProductList | Counter | PAGE_VIEWS.ProductList.count |
| execution.time.fetchProducts | Timer | execution.time.fetchProducts.avg execution.time.fetchProducts.count execution.time.fetchProducts.max execution.time.fetchProducts.sum |
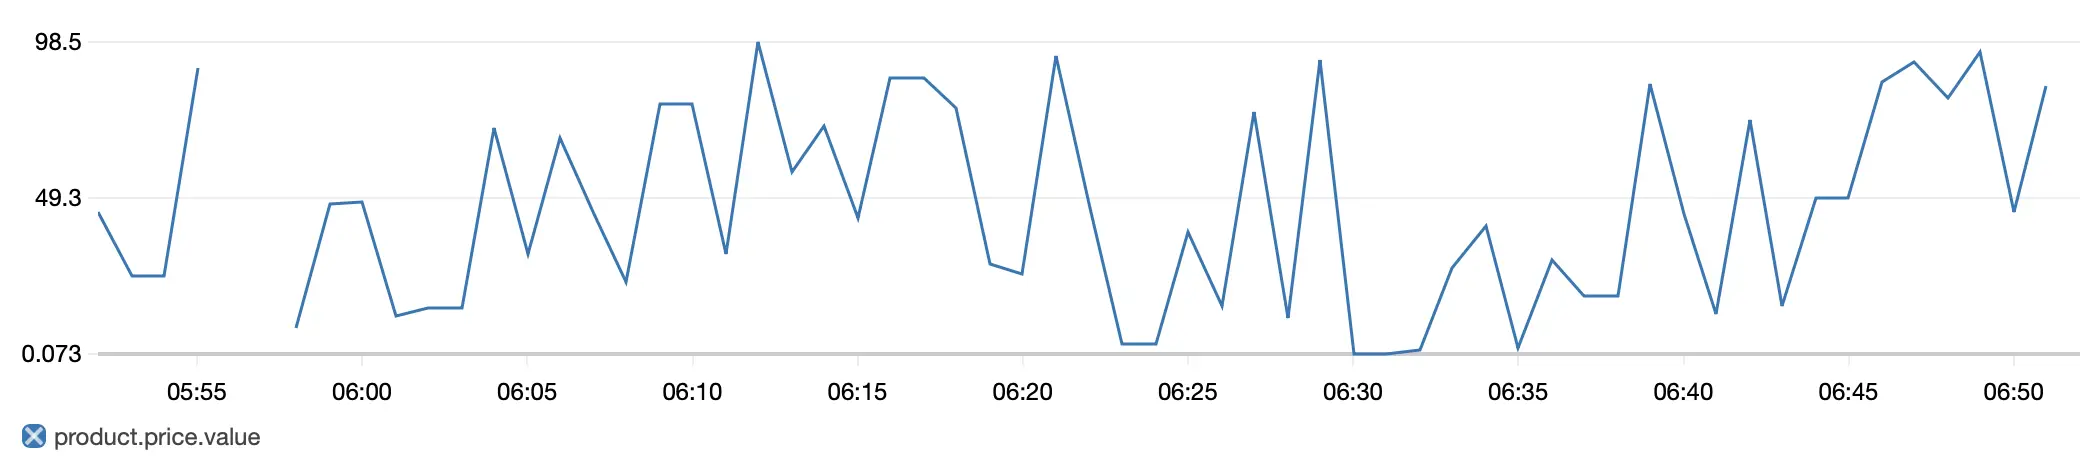
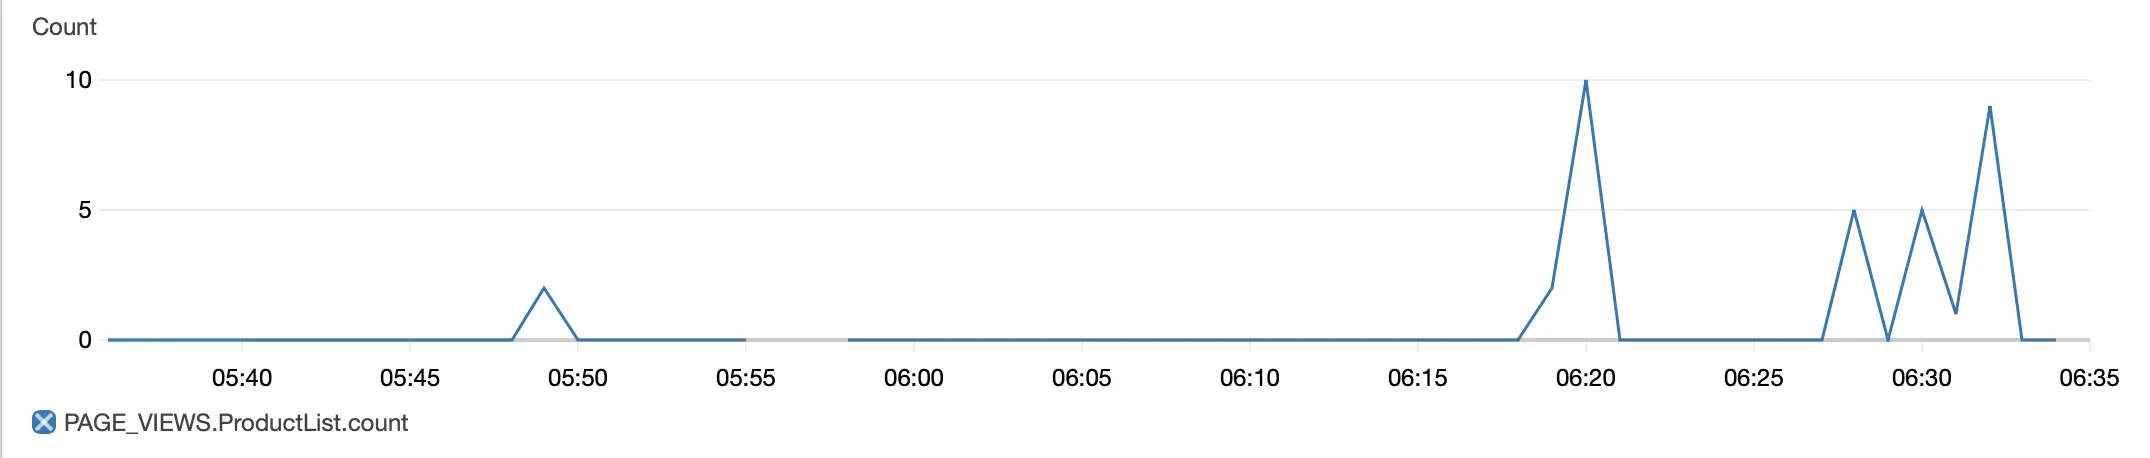
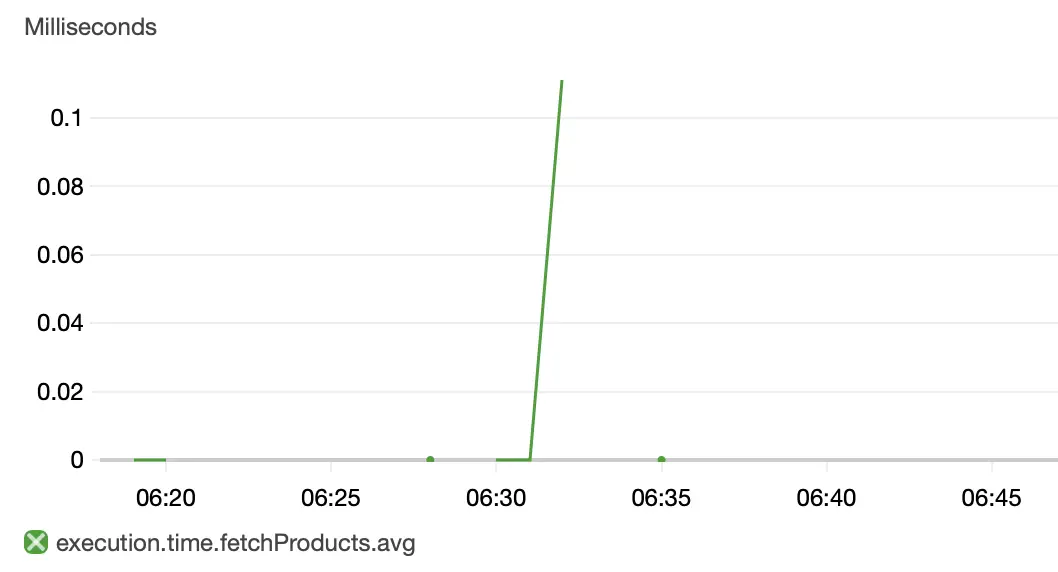
The metric values rendered in the CloudWatch graph is shown below:
The Gauge for tracking the price of a product is mapped to 1 metric named product.price.value.
The Counter for measuring the number of page views of a web page showing list of products is mapped to 1 metric named PAGE_VIEWS.ProductList.count. We measured this in our application by incrementing the meter for page views on every invocation of the fetchProducts API.
The Timer meter for measuring the execution time of the fetchProducts API is mapped to 3 metrics named execution.time.fetchProducts.count, execution.time.fetchProducts.max, and execution.time.fetchProducts.sum representing the API’s total execution time, and maximum and sum of the execution times during an interval.
Generating JVM and System Metrics with Actuator
We can use the Spring Boot Actuator module to generate useful JVM and system metrics. Spring Boot’s Actuator provides dependency management and auto-configuration for Micrometer. So when we add the Actuator dependency, we can remove the dependency on Micrometer’s core module micrometer-core:
    <dependency>
      <groupId>org.springframework.boot</groupId>
      <artifactId>spring-boot-starter-actuator</artifactId>
    </dependency>
    <dependency>
        <groupId>io.micrometer</groupId>
        <artifactId>micrometer-registry-cloudwatch2</artifactId>
    </dependency>
Spring Boot provides automatic meter registration for a wide variety of technologies. In most situations, the out-of-the-box defaults provide sensible metrics that can be published to any of the supported monitoring systems.
For sending the metrics to CloudWatch we need to add two properties to our application.properties:
management.metrics.export.cloudwatch.namespace=productsApp
management.metrics.export.cloudwatch.batchSize=10
Here we have added a property for namespace where the metrics will be collected in CloudWatch. The other property for batchsize is the value of the number of metrics sent in a single batch to CloudWatch.
Auto-configuration will enable JVM metrics using core Micrometer classes. JVM metrics are published under the meter name starting with “jvm.” as shown below:
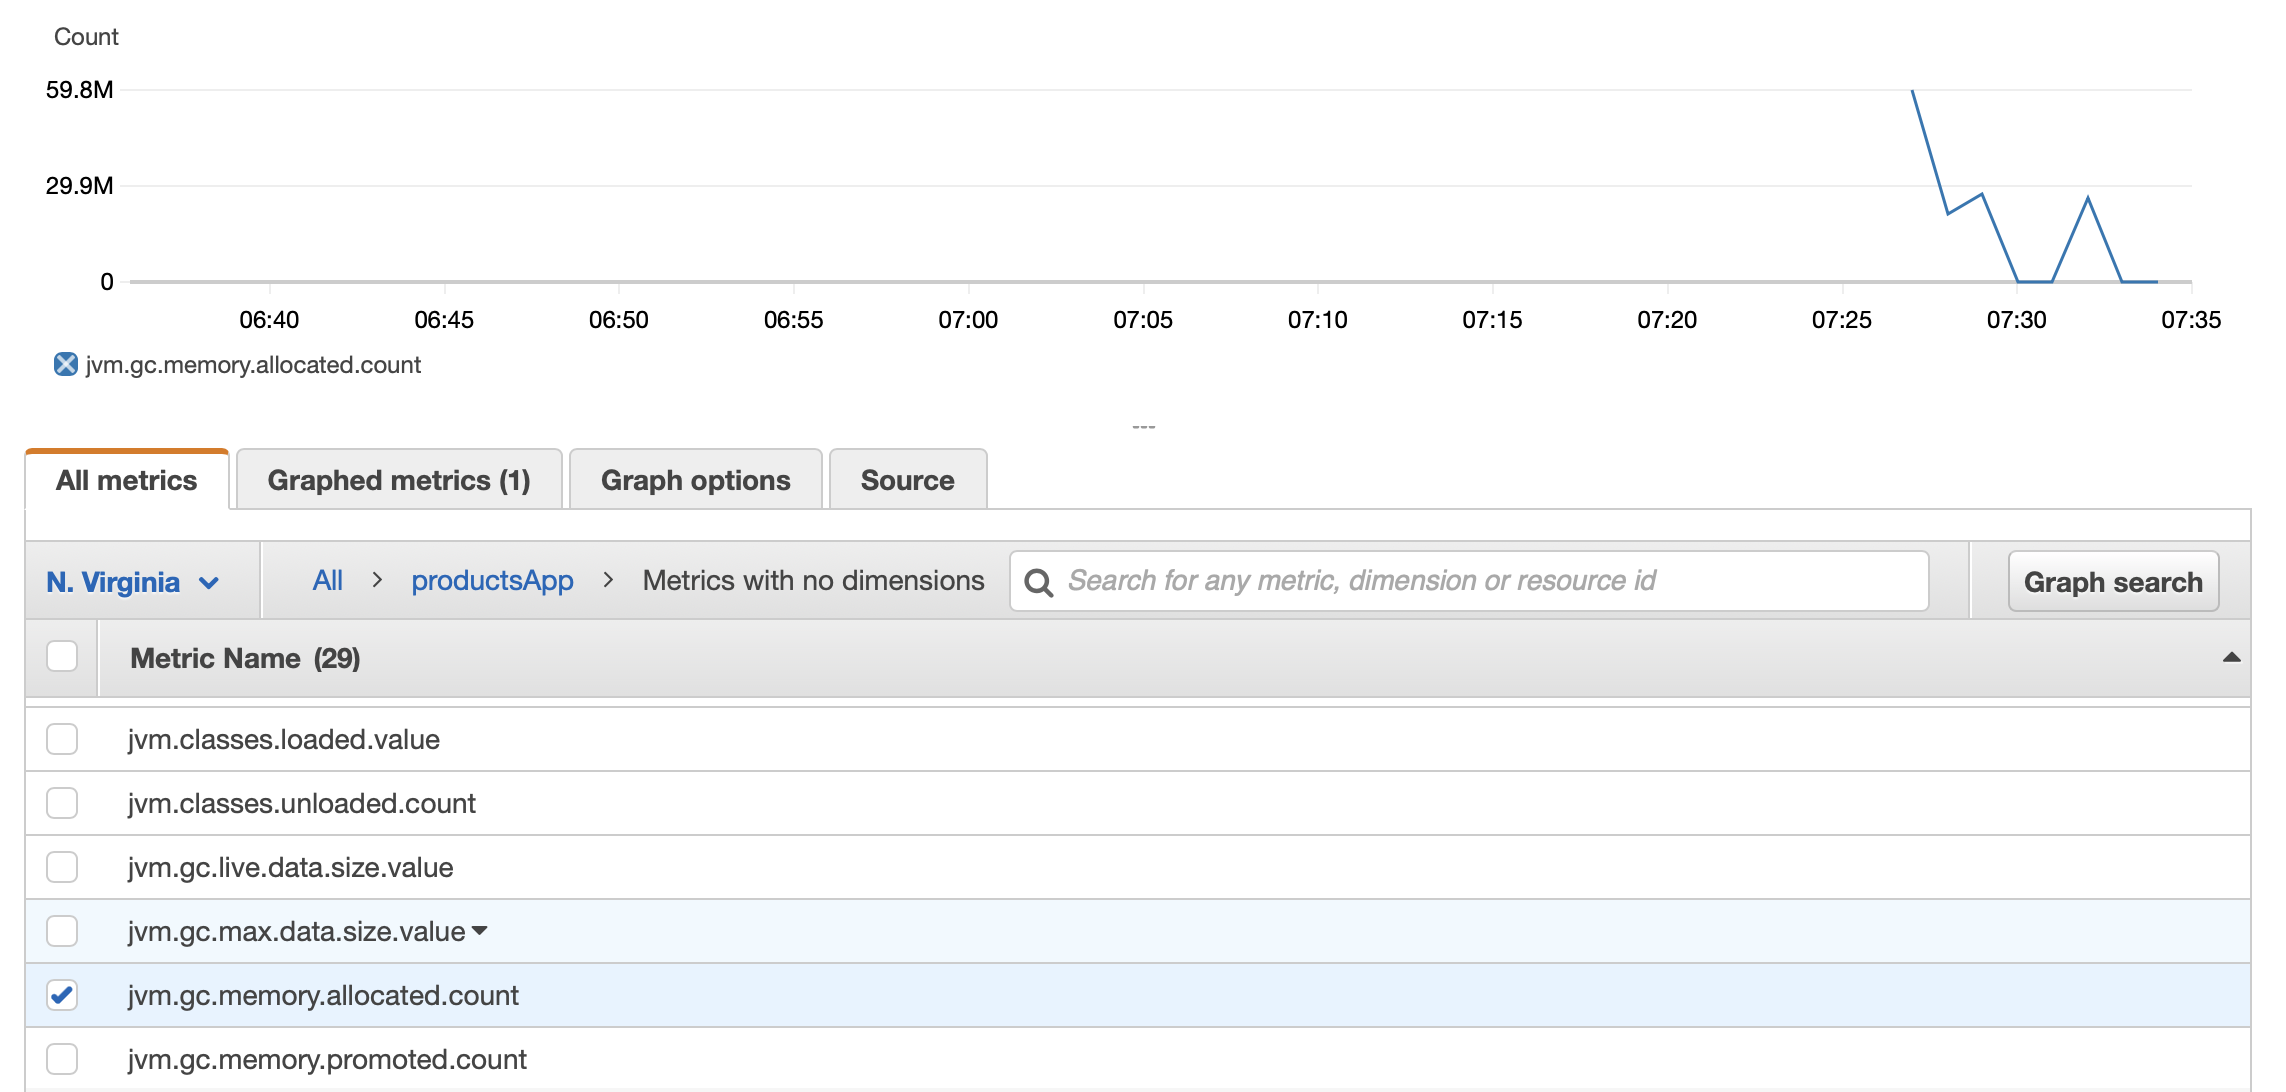
JVM metrics are provided the following information:
- Memory and buffer pool details
- Garbage collection Statistics
- Thread utilization
- The number of classes loaded and unloaded
Auto-configuration will also enable system metrics using core Micrometer classes. System metrics are published under the meter names starting with “system.” and “process.":
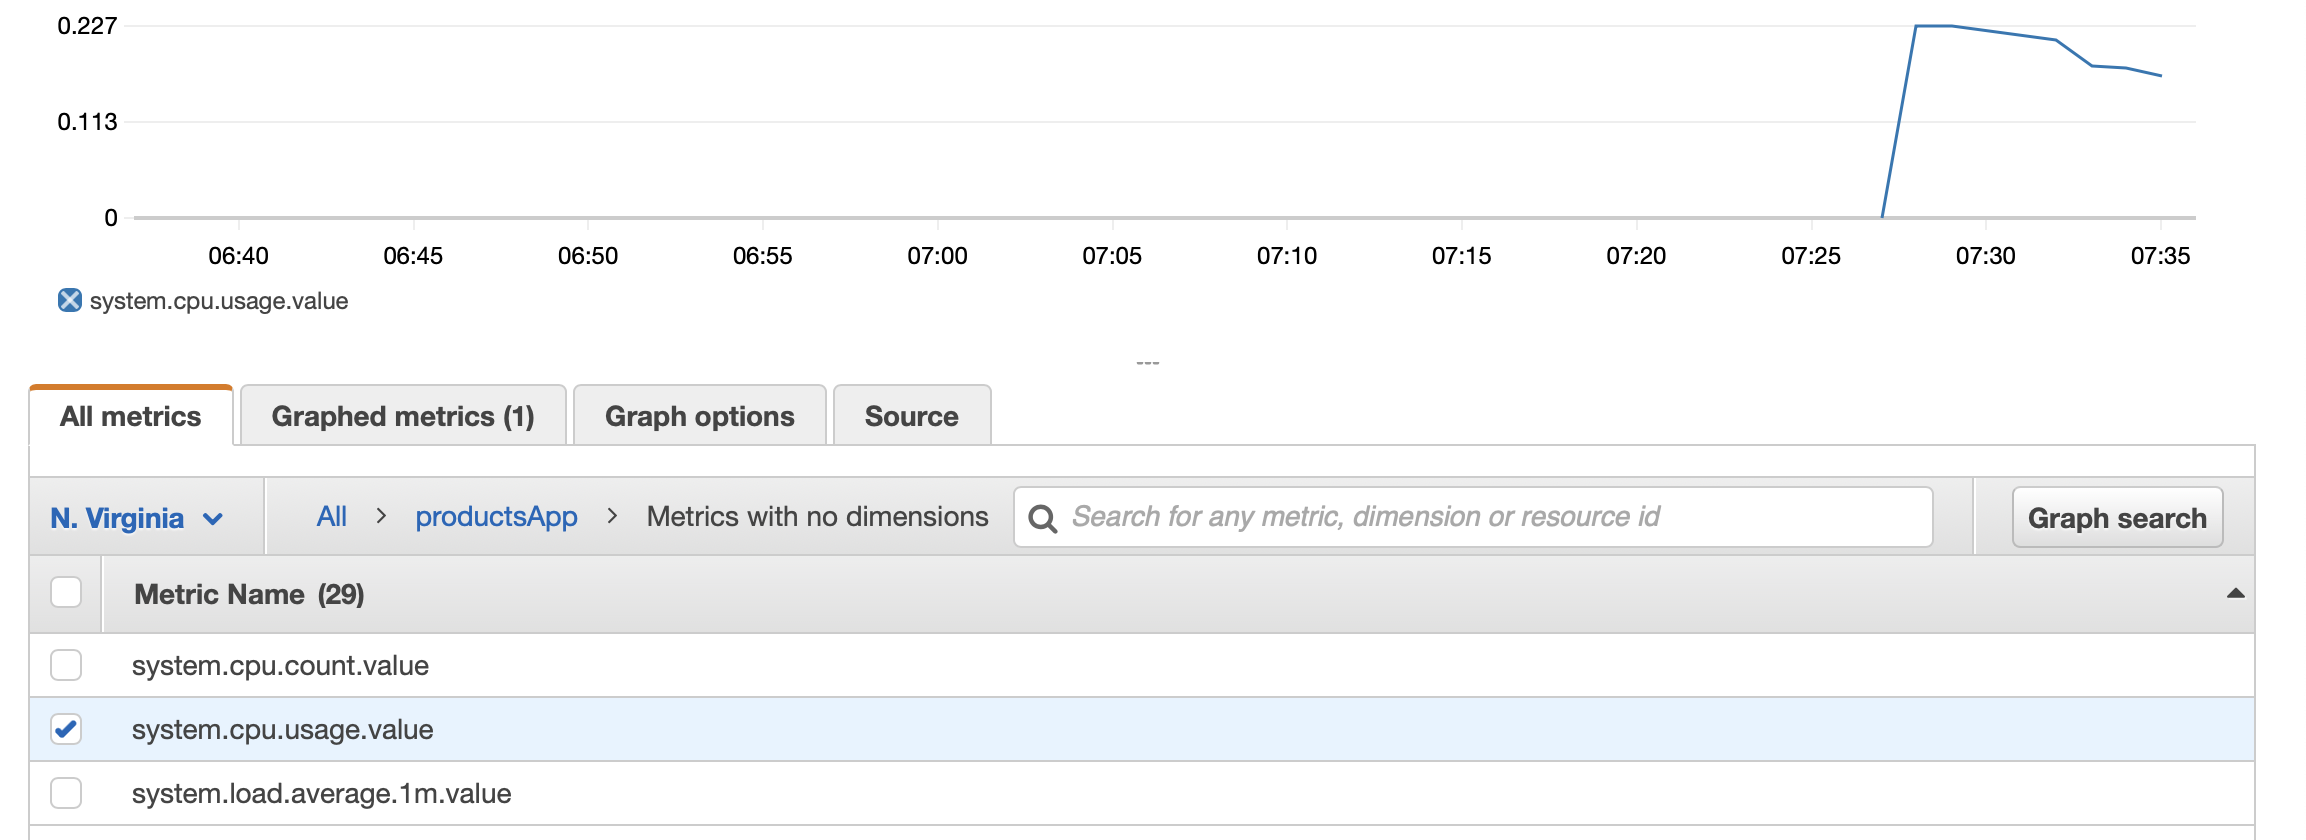
System metrics include the following information :
- CPU metrics
- File descriptor metrics
- Uptime metrics (both the amount of time the application has been running as well as a fixed gauge of the absolute start time)
Using the Metrics to Configure Alarms
Alarms are one of the key components of any monitoring solution. Without going too deep, we will only look at how we can make use of the metrics from our application to set up an alarm. A metric alarm watches a single CloudWatch metric and performs one or more actions based on the value of the metric.
We will create an alarm to monitor the fetch products API. If the API execution time exceeds a particular band, we want to send an email to notify interested parties to take remedial actions.
The diagram here shows the sequence of steps to create this alarm to watch over the metric for the execution time of the fetch products API:
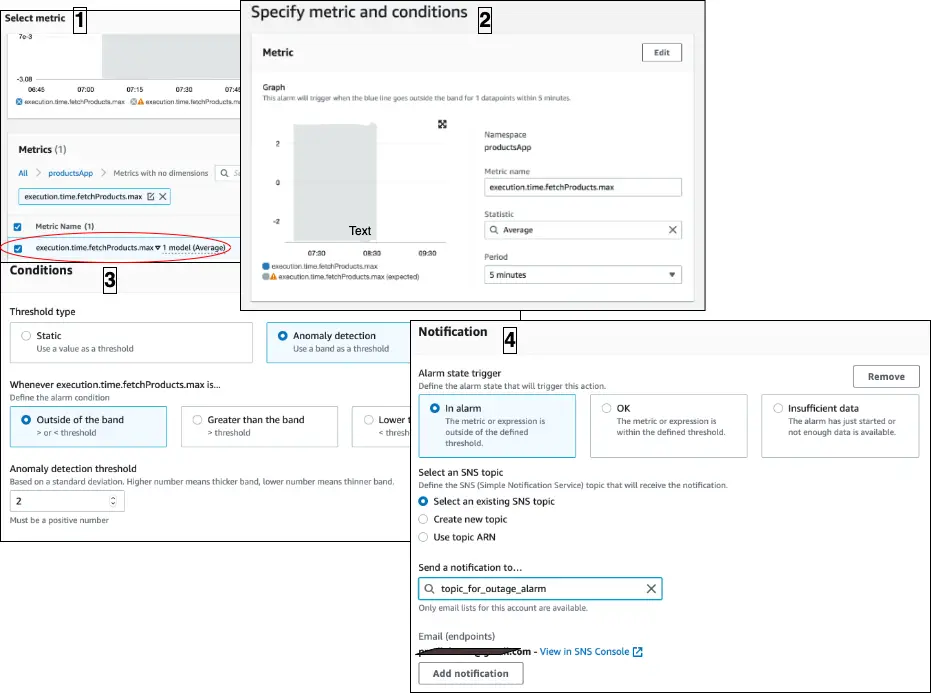
Here we are creating the alarm to watch over metric named execution.time.fetchProducts.max. We have set up the condition for triggering the alarm as “execution.time.fetchProducts.max is outside the band (width: 2) for 1 datapoint within 5 minutes”. When the alarm is triggered, the action is set to fire a notification to an SNS topic, where we have subscribed to an endpoint to send an email.
For more details on creating alarms with CloudWatch, have a look at the Stratospheric book.
Conclusion
Here is a list of important points from the article for quick reference:
- Micrometer is used as a facade to publish metrics from our application to different monitoring systems.
- Micrometer works as a flexible layer of abstraction between our code and the monitoring systems so that we can easily swap or combine them.
- MeterRegistry and Meter are two important concepts in Micrometer.
- Counter, Timer, and Gauge are the three commonly used types of Meter.
- Each monitoring system supported by Micrometer has an implementation of MeterRegistry.
- The meter types are converted to one or more time-series metrics at the time of publishing to the target monitoring system.
- Amazon CloudWatch is a monitoring and observability service in AWS Cloud.
- Namespace, metric, and dimension are three important concepts in Amazon CloudWatch.
- A metric in CloudWatch is uniquely identified by its name, namespace, and dimension.
You can refer to all the source code used in the article on Github.
Check Out the Book!
This article gives only a first impression of what you can do with Amazon CloudWatch.
If you want to go deeper and learn how to deploy a Spring Boot application to the AWS cloud and how to connect it to cloud services like RDS, Cognito, and SQS, make sure to check out the book Stratospheric - From Zero to Production with Spring Boot and AWS!