A thread is a basic path of execution in a program. Most of the applications we build today execute in a multi-threaded environment. They might become unresponsive if the thread executing at that point of time is stuck due to some reason. In these situations, thread dumps help to narrow down the problem.
In this post, we create thread dumps and understand the information they contain to diagnose various runtime errors in applications.
Example Code
This article is accompanied by a working code example on GitHub.What is a Thread Dump?
A thread dump provides a snapshot of all the threads in a program executing at a specific instant. Some of the threads belong to our Java application being run while the remaining are JVM internal threads.
The state of each thread is followed by a stack trace containing the information about the application’s thread activity that can help us diagnose problems and optimize application and JVM performance.
For this reason, a thread dump is a vital tool for analyzing performance degradation (slowness), finding the root cause of an application becoming unresponsive, or for diagnosing deadlock situations.
Lifecycle of a Thread
For understanding a thread dump, it is essential to know all the states a thread passes through during its lifecycle.
A thread can assume one of these states:
-
NEW: Initial state of a thread when we create an instance ofThreadorRunnable. It remains in this state until the program starts the thread. -
RUNNABLE: The thread becomes runnable after a new thread is started. A thread in this state is considered to be executing its task. -
BLOCKED: A thread is in the blocked state when it tries to access an object that is currently used (locked) by some other thread. When the locked object is unlocked and hence available for the thread, the thread moves back to the runnable state. -
WAITING: A thread transitions to the waiting state while waiting for another thread to perform a task and transitions back to the runnable state only when another thread signals the waiting thread to resume execution. -
TIMED_WAITING: A timed waiting state is a thread waiting for a specified interval of time and transitioning back to the runnable state when that time interval expires. The thread is waiting for another thread to do some work for up to a specified waiting time. -
TERMINATED(Dead) A runnable thread enters the terminated state after it finishes its task.
Generating a Thread Dump
We will now generate some thread dumps by running a simple Java program.
Running an Example Program
We will capture the thread dump of an application that simulates a web server. The main method of our application looks like this:
public class App {
  private static final Logger logger = Logger.getLogger(App.class.getName());

  public static void main(String[] args) throws Exception {
        ServerSocket ssock = new ServerSocket(8080);
        logger.info("Server Started. Listening on port 8080");

        while (true) {
           new RequestProcessor(ssock).handleClientRequest();;
        }
  }
}
Here we instantiate a ServerSocket class that listens on port 8080 for incoming client requests and does some processing on the same thread the main() method is working on.
Let us build this program with Maven and then run this program as a Java executable with the command:
java -jar target/ServerApp-1.0-SNAPSHOT.jar
The Java application now listens for requests on port 8080 and responds with a JSON string on receiving HTTP GET requests on the URL http://localhost:8080/.
Generating the Thread Dump
We will now use a utility named jcmd to generate a thread dump of the application we started in the previous step. The jcmd utility sends diagnostic command requests to the Java Virtual Machine(JVM).
For this, we will first find the process identifier(PID) of the application by running the jps command:
jps -l
Running the jps command gives the following output:
753 target/ServerApp-1.0-SNAPSHOT.jar
754 jdk.jcmd/sun.tools.jps.Jps
Each line of the output contains the PID and the name of our class containing the main method.
Alternatively, we can find the PID by running ps -a in Unix or Linux systems.
We will now generate the thread dump by running the jcmd command:
jcmd 753 Thread.print > threadDump.txt
The generated thread dump output is written to the threadDump.txt file. A snippet from the thread dump file is shown here:
2021-04-18 15:54:38
Full thread dump OpenJDK 64-Bit Server VM (14.0.1+7 mixed mode, sharing):
...

"main" #1 prio=5 os_prio=31 cpu=111.41ms elapsed=67.87s tid=0x00007f96fb009000 nid=0x2003 runnable  [0x00007000008f0000]
   java.lang.Thread.State: RUNNABLE
  at sun.nio.ch.Net.accept(java.base@14.0.1/Native Method)
  at sun.nio.ch.NioSocketImpl.accept(java.base@14.0.1/NioSocketImpl.java:755)
  at java.net.ServerSocket.implAccept(java.base@14.0.1/ServerSocket.java:684)
  at java.net.ServerSocket.platformImplAccept(java.base@14.0.1/ServerSocket.java:650)
  at java.net.ServerSocket.implAccept(java.base@14.0.1/ServerSocket.java:626)
  at java.net.ServerSocket.implAccept(java.base@14.0.1/ServerSocket.java:583)
  at java.net.ServerSocket.accept(java.base@14.0.1/ServerSocket.java:540)
  at io.pratik.RequestProcessor.handleClientRequest(RequestProcessor.java:32)
  at io.pratik.App.main(App.java:18)


"Reference Handler" #2 daemon prio=10 os_prio=31 cpu=0.10ms elapsed=67.86s tid=0x00007f96fd001000 nid=0x3203 waiting on condition  [0x0000700001005000]
   java.lang.Thread.State: RUNNABLE
...
"Finalizer" #3 daemon prio=8 os_prio=31 cpu=0.17ms elapsed=67.86s tid=0x00007f96fd002800 nid=0x3403 in Object.wait()  [0x0000700001108000]
   java.lang.Thread.State: WAITING (on object monitor)
...
"Signal Dispatcher" #4 daemon prio=9 os_prio=31 cpu=0.24ms elapsed=67.85s tid=0x00007f96fb0d6800 nid=0xa703 runnable  [0x0000000000000000]
   java.lang.Thread.State: RUNNABLE
...
...
"Common-Cleaner" #12 daemon prio=8 os_prio=31 cpu=0.21ms elapsed=67.84s tid=0x00007f96fd06d800 nid=0x9e03 in Object.wait()  [0x0000700001920000]
   java.lang.Thread.State: TIMED_WAITING (on object monitor)
...
"Attach Listener" #14 daemon prio=9 os_prio=31 cpu=1.61ms elapsed=14.58s tid=0x00007f96fc85d800 nid=0x6207 waiting on condition  [0x0000000000000000]
   java.lang.Thread.State: RUNNABLE
...
...

"G1 Young RemSet Sampling" os_prio=31 cpu=11.18ms elapsed=67.87s tid=0x00007f96fb0ab800 nid=0x2f03 runnable
"VM Periodic Task Thread" os_prio=31 cpu=56.37ms elapsed=67.84s tid=0x00007f96fc848800 nid=0x6003 waiting on condition
...
We can see the main thread is in the RUNNABLE state with a thread id (tid), cpu time, and priority. Each thread information is accompanied by its stack trace. The stack trace of the main thread shows the handleClientRequest() method of the RequestProcessor getting invoked from the main method in the last two lines. Apart from the main thread in the RUNNABLE state, we can see some threads in states WAITING, and TIMED_WAITING.
Anatomy of a Thread Dump Entry
Let us now understand the fields present in each thread dump line by looking at an entry from a thread dump of a Kafka broker:
"main-EventThread" #20 daemon prio=5 os_prio=31 cpu=10.36ms elapsed=90.79s tid=0x00007fa0e021a800 nid=0x6503 waiting on condition  [0x0000700003098000]
   java.lang.Thread.State: WAITING (parking)
  at jdk.internal.misc.Unsafe.park(java.base@14.0.1/Native Method)
  - parking to wait for  <0x00000007c8103d70> (a java.util.concurrent.locks.AbstractQueuedSynchronizer$ConditionObject)
  at java.util.concurrent.locks.LockSupport.park(java.base@14.0.1/LockSupport.java:341)
  at java.util.concurrent.locks.AbstractQueuedSynchronizer$ConditionNode.block(java.base@14.0.1/AbstractQueuedSynchronizer.java:505)
  at java.util.concurrent.ForkJoinPool.managedBlock(java.base@14.0.1/ForkJoinPool.java:3137)
  at java.util.concurrent.locks.AbstractQueuedSynchronizer$ConditionObject.await(java.base@14.0.1/AbstractQueuedSynchronizer.java:1614)
  at java.util.concurrent.LinkedBlockingQueue.take(java.base@14.0.1/LinkedBlockingQueue.java:435)
  at org.apache.zookeeper.ClientCnxn$EventThread.run(ClientCnxn.java:506)
The thread dump entry shown here starts with the name of the thread main-EventThread which is the 20th thread (indicated by#20) created by the JVM after it started.
The daemon keyword after the thread number indicates that this is a daemon thread, which means that it will not prevent the JVM from shutting down if it is the last running thread.
Then there are less important pieces of metadata about the thread, like a priority, os priority, thread identifier, and native identifier.
The last pieces of information are the most important the state of the thread and its address in the JVM. The thread can be in one of the four states as explained earlier.
Different Ways of Taking a Thread Dump
There are various methods of taking the thread dump. We used JDK’s jcmd utility in the previous section for taking the thread dumps. Let us look at some of the other methods.
Taking Thread Dump with Tools
Some of the commonly used tools for taking thread dump are:
- jstack:
jstackis part of JDK since Java 5 and is widely used for taking thread dumps. We take thread dump withjstackwith the below command:
sudo -u <java-user> java-service jstack -l <pid>
In this command, we should replace
Using the -l option, we can include in the output, ownable synchronizers in the heap, and locks. However, with the release of JDK 8, Oracle suggests using jcmd for taking thread dumps instead of the jstack for enhanced diagnostics and reduced performance overhead.
-
VisualVM: VisualVM is a graphical user interface (GUI) tool that provides detailed runtime information about the Java application. We use this runtime information to monitor, troubleshoot, and profile those applications. It has the additional capability to capture thread dumps from the java processes running in a remote host. From Java 9 onwards, VisualVM is distributed separately from JDK and can be downloaded from the project’s website.
-
JMC: Java Mission Control (JMC) is also a GUI tool to collect and analyze data from Java applications. Like Visual VM, this can also connect to remote Java processes to capture thread dump.
-
OS utilities: We can use the commands
kill -3 <pid>in Unix andctrl+breakin Windows to generate a thread dump in the console where our java program is running. The Java process prints the thread dump on the standard output on receiving the signal. -
Application Performance Monitoring (APM) Tools: Few APM tools provide options to generate thread dumps. For example, AppDynamics provides this capability as part of its diagnostic actions, by directing its Java agent to take a thread dump for a specified number of samples with each sample lasting for a specified number of milliseconds. The thread dump is executed on the node monitored by the agent.
Taking a Thread Dump Programmatically with JMX
ThreadMXBean is the management interface for the thread system in the Java Virtual Machine. A sample program to generate thread dump is given here:
public class ThreadMXBeanSample {
  private static final Logger logger =
          Logger.getLogger(ThreadMXBeanSample.class.getName());

  public static void main(String[] args) {
    startThreads();
    ThreadMXBean threadMxBean =
            ManagementFactory.getThreadMXBean();
    for (ThreadInfo ti : threadMxBean.dumpAllThreads(true, true)) {
      logger.info(ti.toString());
    }
    ...
    logger.info("Total number of threads created and started : " +
            threadMxBean.getTotalStartedThreadCount());
  }

  /**
   * Starts two threads Thread1 and Thread2 and calls their
   * synchronized methods in the run method resulting in a deadlock.
   */
  private static void startThreads() {
    final ThreadSample thread1 = new ThreadSample();
    final ThreadSample thread2 = new ThreadSample();
    Thread t1 = new Thread("Thread1") {
      public void run() {
        thread1.executeMethod1(thread2);
      }
    };

    Thread t2 = new Thread("Thread2") {
      @Override
      public void run() {
        thread2.executeMethod2(thread1);
      }
    };

    t1.start();
    t2.start();
  }
}
In this snippet, the thread dump is generated by calling the dumpAllThreads() method. Before that we start two threads, each invoking synchronized method on ThreadSample class to provoke a BLOCKED thread state. A part of the thread dump is given here:
Apr 20, 2021 8:09:11 AM io.pratik.threadops.ThreadMXBeanSample main
INFO: "Thread1" prio=5 Id=14 BLOCKED on io.pratik.threadops.ThreadSample@5b6f7412 owned by "Thread2" Id=15
  at app//io.pratik.threadops.ThreadSample.executeMethod2(ThreadSample.java:22)
  -  blocked on io.pratik.threadops.ThreadSample@5b6f7412
  at app//io.pratik.threadops.ThreadSample.executeMethod1(ThreadSample.java:17)
  -  locked io.pratik.threadops.ThreadSample@34c45dca
  at app//io.pratik.threadops.ThreadMXBeanSample$1.run(ThreadMXBeanSample.java:43)


Apr 20, 2021 8:09:11 AM io.pratik.threadops.ThreadMXBeanSample main
INFO: "Thread2" prio=5 Id=15 BLOCKED on io.pratik.threadops.ThreadSample@34c45dca owned by "Thread1" Id=14
  at app//io.pratik.threadops.ThreadSample.executeMethod1(ThreadSample.java:16)
  -  blocked on io.pratik.threadops.ThreadSample@34c45dca
  at app//io.pratik.threadops.ThreadSample.executeMethod2(ThreadSample.java:23)
  -  locked io.pratik.threadops.ThreadSample@5b6f7412
  at app//io.pratik.threadops.ThreadMXBeanSample$2.run(ThreadMXBeanSample.java:50)
We can see the two threads Thread1 and Thread2 in the BLOCKED state. If we follow the stack trace of Thread1, ThreadSample object is locked at method executeMethod1 and blocked at executeMethod2.
Analyzing Thread Dumps
FastThread is one of the available tools for analyzing thread dumps.
Let us upload our thread dump file generated from a Kafka broker to the FastThread tool.
FastThread generates a report from the thread dump which is much easier to understand compared to the raw file. Let us look at some of the useful sections of the report:
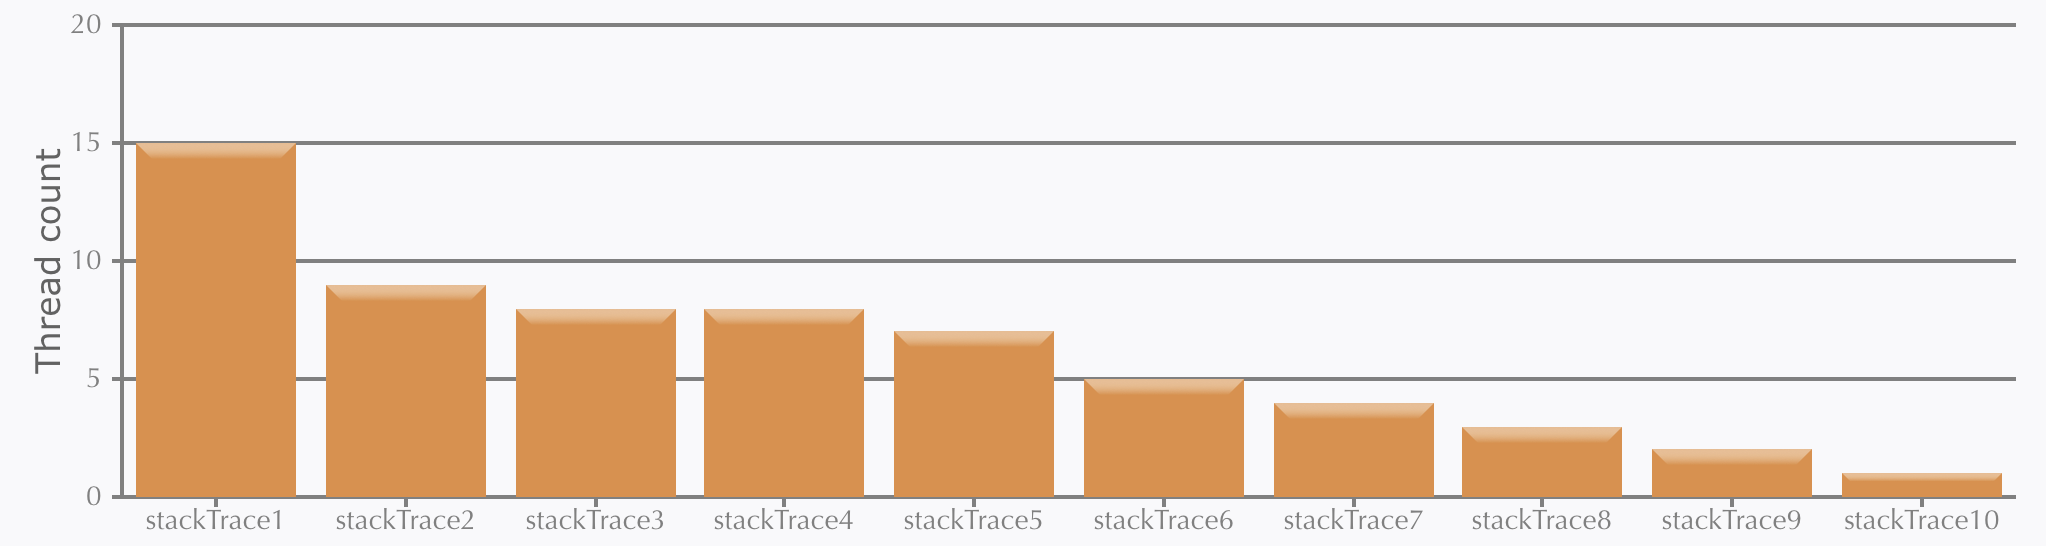
- Threads with identical stack trace: This section of the report shows information when several threads in a thread dump working on one single method. This is indicative of resource contention on external resources like databases or APIs or infinite loops. That particular method needs to be analyzed to find the root cause.
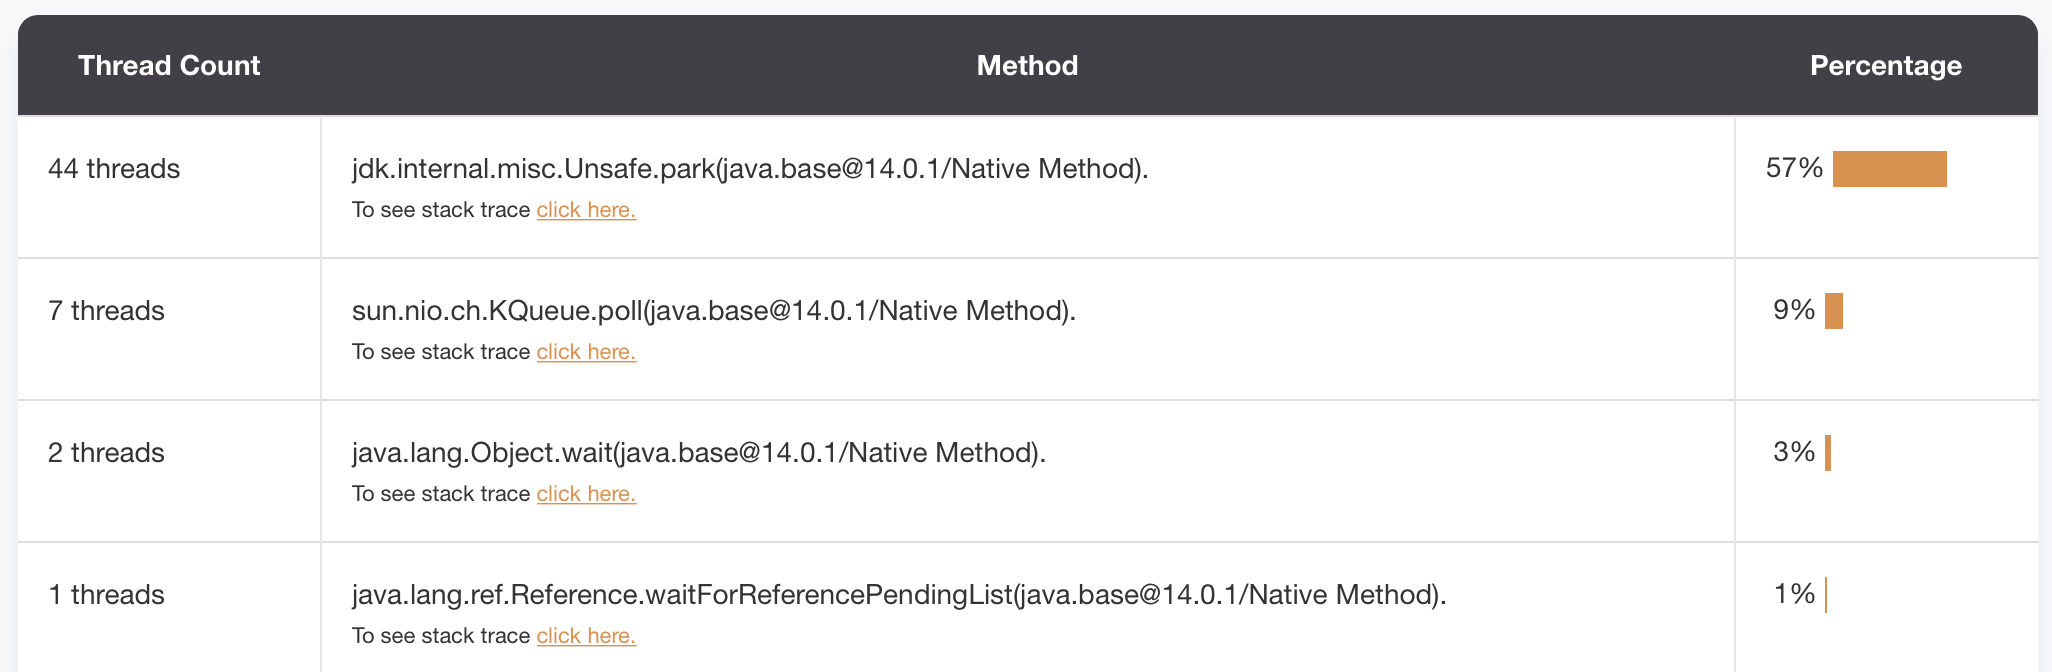
- Most used methods: By taking multiple consecutive thread dumps in a sequence, we can get an overview of the parts of our Java application that are used the most.
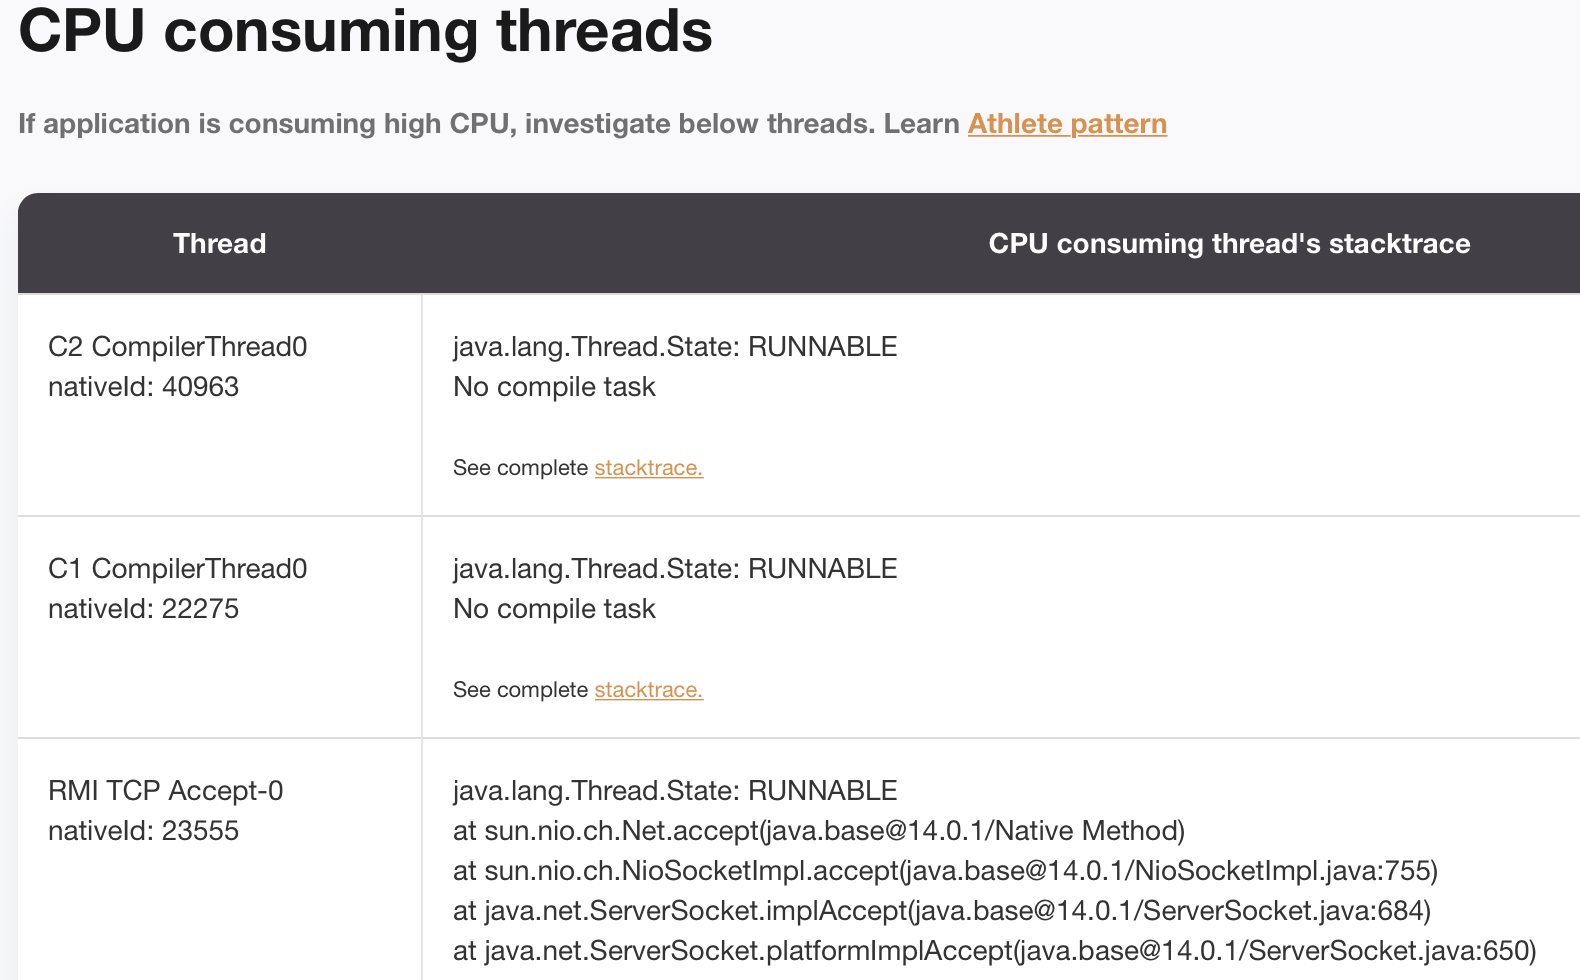
- CPU consuming threads: The report lists all threads which need to be analyzed for high CPU consumption.
- Blocking threads: Blocking threads that are responsible for making an application unresponsive are listed under this section.
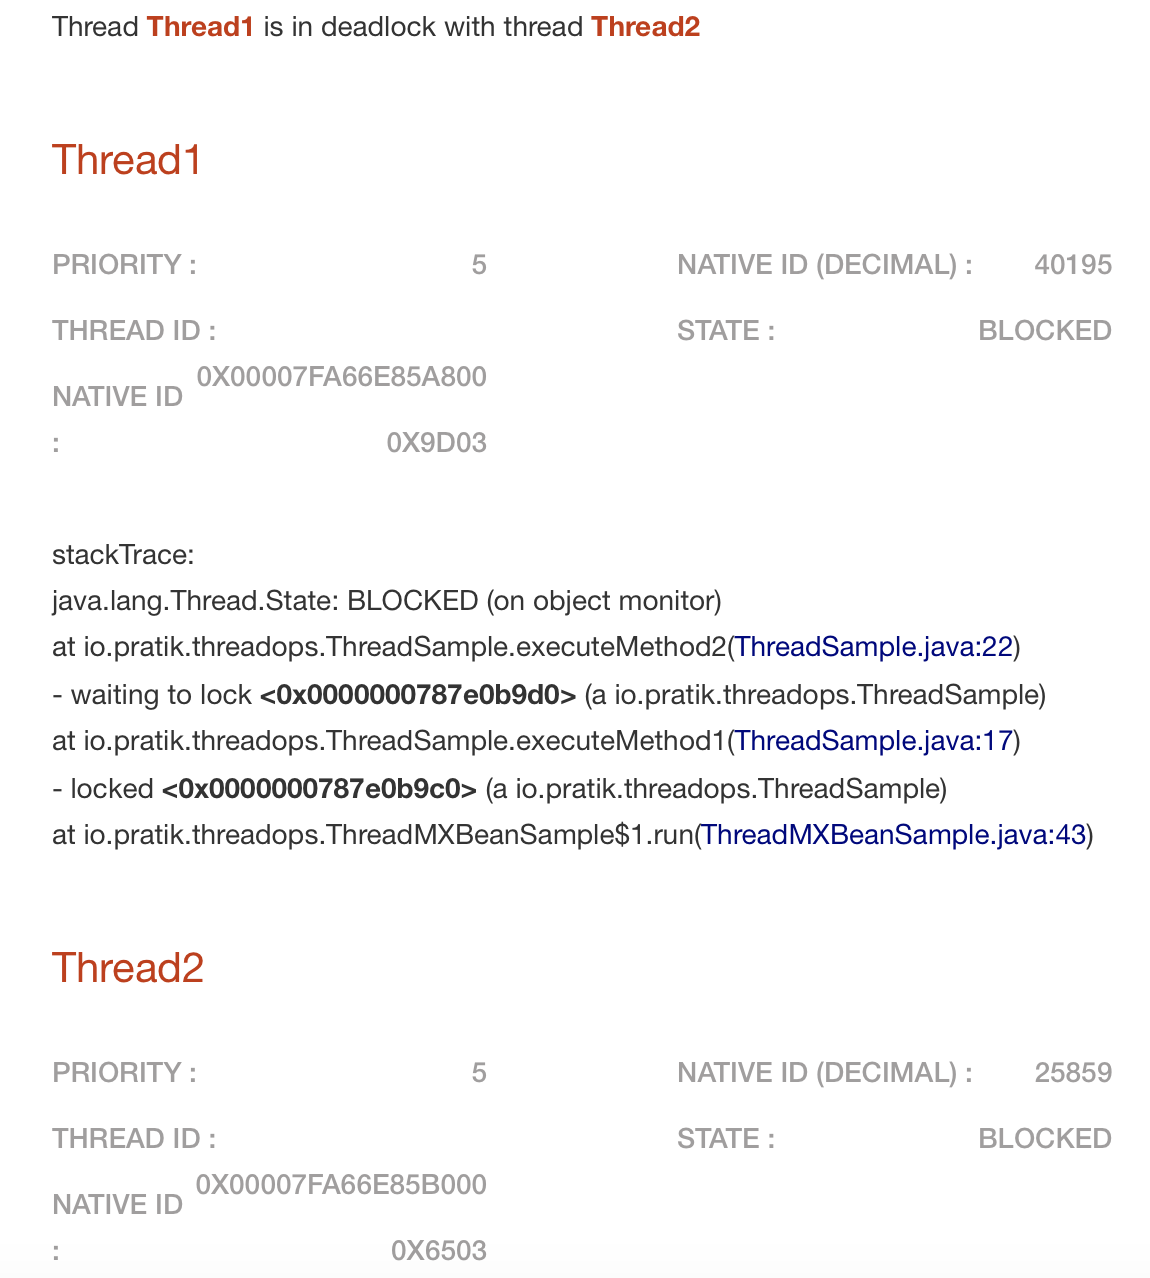
- Deadlocks: This section contains threads that are causing a deadlock. The deadlock section of the previous example is shown here:
- Exceptions: Thread dumps contain exceptions and errors in the thread’s stack trace. These should be investigated to look for the root cause of a problem.
- Flame Graph: A flame graph condenses all the information from the thread dump into one single compactgraph. It helps to identify hot code paths for effective debugging/troubleshooting. The flame graph of our previous program for causing deadlock is shown here:
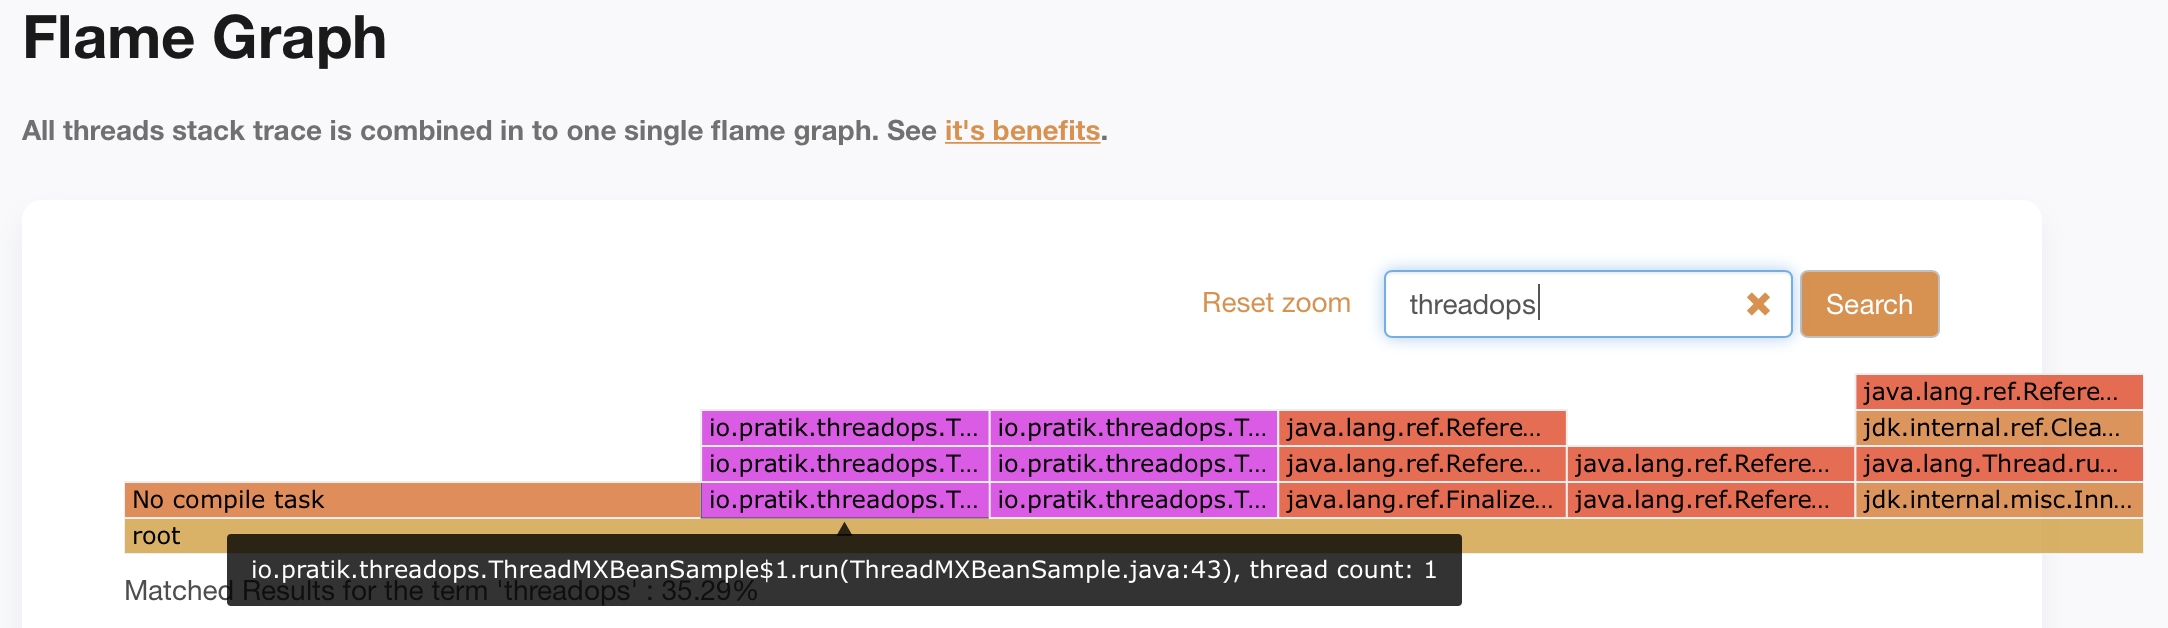
We can see the flame graph is searched for classes in the package threadops and showing the search results in pink color. The number of threads of that class is displayed on hovering over the cell.
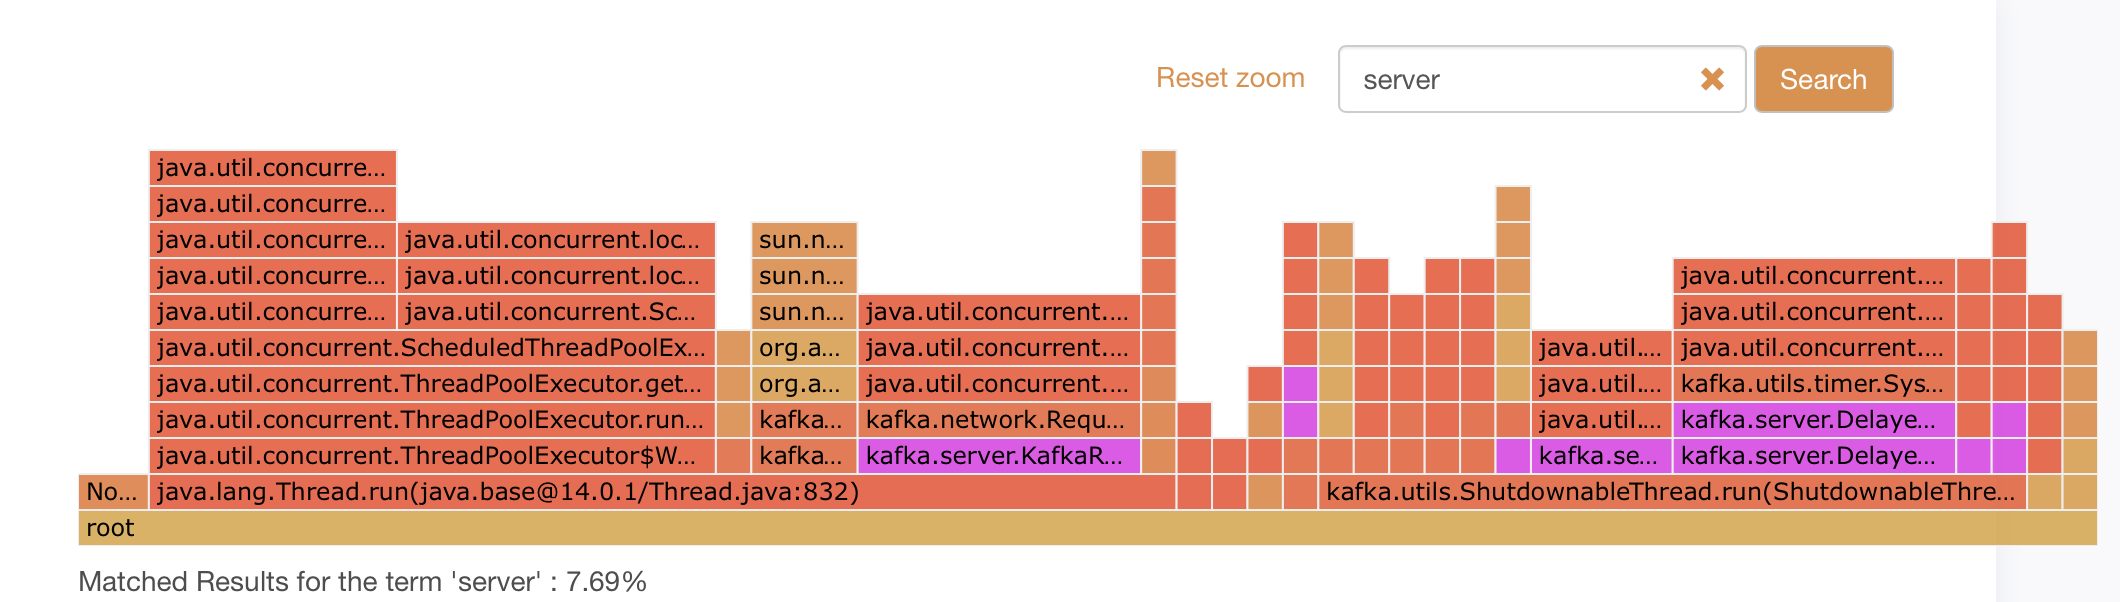
Another flame graph of a Kafka broker is given here:
IBM TDMA, samurai, and Spotify’s thread dump analyzer are some of the other tools for analyzing thread dumps.
Manual analysis of raw thread dump files is always an option but is often tedious and time-consuming due to its verbose nature. Irrespective of the method used to analyze thread dumps, the results of the analysis can be used to diagnose a wide range of problems common in live systems.
Conclusion
In this post, we looked at the different lifecycle states of a Java thread and described thread dumps as a snapshot of thread states at a particular instant. We then ran a simple Java application to simulate a web server and took its thread dump with the jcmd tool.
After that, we introduced tools to analyze thread dumps and ended with some use cases and best practices of using thread dumps. A thread dump is often used in combination with heap dump and GC logs to diagnose java applications.
I hope this will enable you to use thread dumps for the use cases described here and also find other areas where it can be put to use like automation with Ci/CD.
You can refer to all the source code used in the article on Github.