As Java developers, we are familiar with our applications throwing OutOfMemoryErrors or our server monitoring tools throwing alerts and complaining about high JVM memory utilization.
To investigate memory problems, the JVM Heap Memory is often the first place to look at.
To see this in action, we will first trigger an OutOfMemoryError and then capture a heap dump. We will next analyze this heap dump to identify the potential objects which could be the cause of the memory leak.
Example Code
This article is accompanied by a working code example on GitHub.What is a Heap Dump?
Whenever we create a Java object by creating an instance of a class, it is always placed in an area known as the heap. Classes of the Java runtime are also created in this heap.
The heap gets created when the JVM starts up. It expands or shrinks during runtime to accommodate the objects created or destroyed in our application.
When the heap becomes full, the garbage collection process is run to collect the objects that are not referenced anymore (i.e. they are not used anymore). More information on memory management can be found in the Oracle docs.
Heap dumps contain a snapshot of all the live objects that are being used by a running Java application on the Java heap. We can obtain detailed information for each object instance, such as the address, type, class name, or size, and whether the instance has references to other objects.
Heap dumps have two formats:
- the classic format, and
- the Portable Heap Dump (PHD) format.
PHD is the default format. The classic format is human-readable since it is in ASCII text, but the PHD format is binary and should be processed by appropriate tools for analysis.
Sample Program to Generate an OutOfMemoryError
To explain the analysis of a heap dump, we will use a simple Java program to generate an OutOfMemoryError:
public class OOMGenerator {

  /**
   * @param args
   * @throws Exception
   */
  public static void main(String[] args) throws Exception {

    System.out.println("Max JVM memory: " + Runtime.getRuntime().maxMemory());
    try {
      ProductManager productManager = new ProductManager();
      productManager.populateProducts();

    } catch (OutOfMemoryError outofMemory) {
      System.out.println("Catching out of memory error");

      throw outofMemory;
    }
  }
}
public class ProductManager {
  private static ProductGroup regularItems = new ProductGroup();

  private static ProductGroup discountedItems = new ProductGroup();

  public void populateProducts() {

    int dummyArraySize = 1;
    for (int loop = 0; loop < Integer.MAX_VALUE; loop++) {
      if(loop%2 == 0) {
        createObjects(regularItems, dummyArraySize);
      }else {
        createObjects(discountedItems, dummyArraySize);
      }
      System.out.println("Memory Consumed till now: " + loop + "::"+ regularItems + " "+discountedItems );
      dummyArraySize *= dummyArraySize * 2;
    }
  }

  private void createObjects(ProductGroup productGroup, int dummyArraySize) {
    for (int i = 0; i < dummyArraySize; ) {
      productGroup.add(createProduct());
    }
  }

  private AbstractProduct createProduct() {
        int randomIndex = (int) Math.round(Math.random() * 10);
        switch (randomIndex) {
          case 0:
            return  new ElectronicGood();
          case 1:
            return  new BrandedProduct();
          case 2:
            return new GroceryProduct();
          case 3:
            return new LuxuryGood();
          default:
            return  new BrandedProduct();
        }

  }

}
We keep on allocating the memory by running a for loop until a point is reached, when JVM does not have enough memory to allocate, resulting in an OutOfMemoryError being thrown.
Finding the Root Cause of an OutOfMemoryError
We will now find the cause of this error by doing a heap dump analysis. This is done in two steps:
- Capture the heap dump
- Analyze the heap dump file to locate the suspected reason.
We can capture heap dump in multiple ways. Let us capture the heap dump for our example first with jmap and then by passing a VM argument in the command line.
Generating a Heap Dump on Demand with jmap
jmap is packaged with the JDK and extracts a heap dump to a specified file location.
To generate a heap dump with jmap, we first find the process ID of our running Java program with the jps tool to list down all the running Java processes on our machine:
...:~ fab$ jps
10514
24007
41927 OOMGenerator
41949 Jps
After running the jps command, we can see the processes are listed in the format “
Next, we run the jmap command to generate the heap dump file:
jmap -dump:live,file=mydump.hprof 41927
After running this command the heap dump file with extension hprof is created.
The option live is used to collect only the live objects that still have a reference in the running code. With the live option, a full GC is triggered to sweep away unreachable objects and then dump only the live objects.
Automatically Generating a Heap Dump on OutOfMemoryErrors
This option is used to capture a heap dump at the point in time when an OutOfMemoryError occurred. This helps to diagnose the problem because we can see what objects were sitting in memory and what percentage of memory they were occupying right at the time of the OutOfMemoryError.
We will use this option for our example since it will give us more insight into the cause of the crash.
Let us run the program with the VM option HeapDumpOnOutOfMemoryError from the command line or our favorite IDE to generate the heap dump file:
java -jar target/oomegen-0.0.1-SNAPSHOT.jar \
-XX:+HeapDumpOnOutOfMemoryError \
-XX:HeapDumpPath=<File path>hdump.hprof
After running our Java program with these VM arguments, we get this output:
Max JVM memory: 2147483648
Memory Consumed till now: 960
Memory Consumed till now: 29760
Memory Consumed till now: 25949760
java.lang.OutOfMemoryError: Java heap space
Dumping heap to <File path>/hdump.hprof ...
Heap dump file created [17734610 bytes in 0.031 secs]
Catching out of memory error
Exception in thread "main" java.lang.OutOfMemoryError: Java heap space
  at io.pratik.OOMGenerator.main(OOMGenerator.java:25)
As we can see from the output, the heap dump file with the name: hdump.hprof is created when the OutOfMemoryError occurs.
Other Methods of Generating Heap Dumps
Some of the other methods of generating a heap dump are:
-
jcmd: jcmd is used to send diagnostic command requests to the JVM. It is packaged as part of the JDK. It can be found in the
\binfolder of a Java installation. -
JVisualVM: Usually, analyzing heap dump takes more memory than the actual heap dump size. This could be problematic if we are trying to analyze a heap dump from a large server on a development machine. JVisualVM provides a live sampling of the Heap memory so it does not eat up the whole memory.
Analyzing the Heap Dump
What we are looking for in a Heap dump is:
- Objects with high memory usage
- Object graph to identify objects of not releasing memory
- Reachable and unreachable objects
Eclipse Memory Analyzer (MAT) is one of the best tools to analyze Java heap dumps. Let us understand the basic concepts of Java heap dump analysis with MAT by analyzing the heap dump file we generated earlier.
We will first start the Memory Analyzer Tool and open the heap dump file. In Eclipse MAT, two types of object sizes are reported:
- Shallow heap size: The shallow heap of an object is its size in the memory
- Retained heap size: Retained heap is the amount of memory that will be freed when an object is garbage collected.
Overview Section in MAT
After opening the heap dump, we will see an overview of the application’s memory usage.
The piechart shows the biggest objects by retained size in the overview tab as shown here:
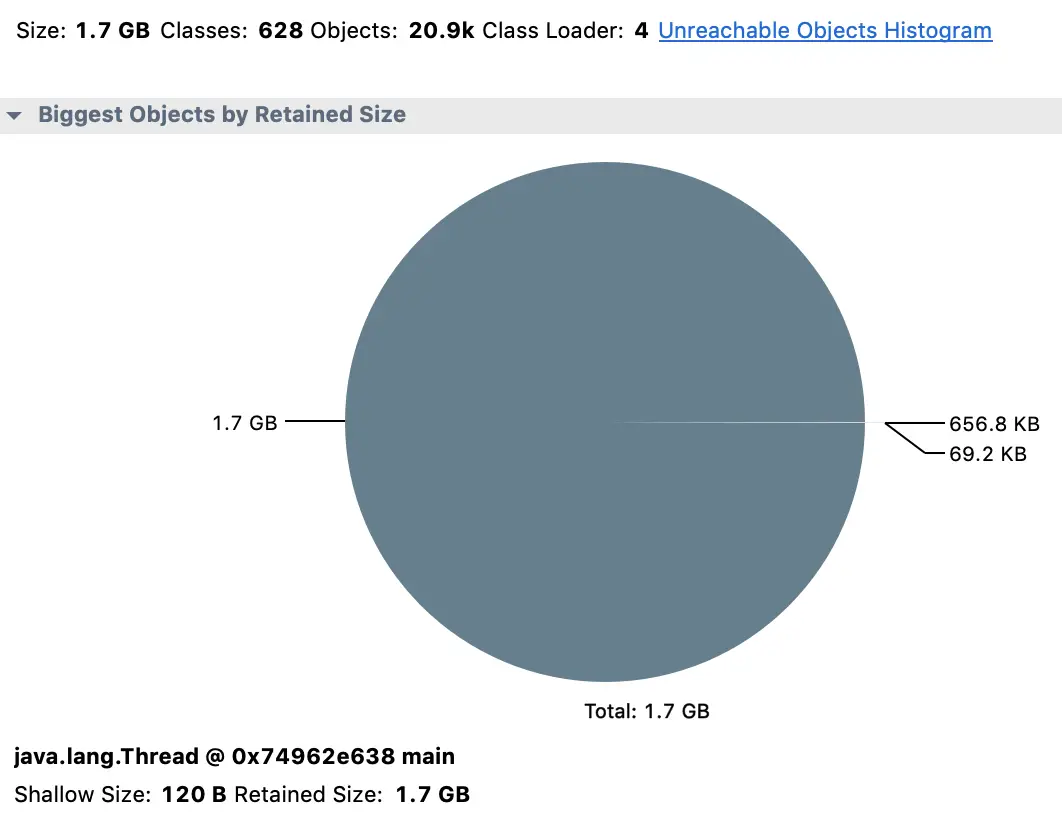
For our application, this information in the overview means if we could dispose of a particular instance of java.lang.Thread we will save 1.7 GB, and almost all of the memory used in this application.
Histogram View
While that might look promising, java.lang.Thread is unlikely to be the real problem here. To get a better insight into what objects currently exist, we will use the Histogram view:
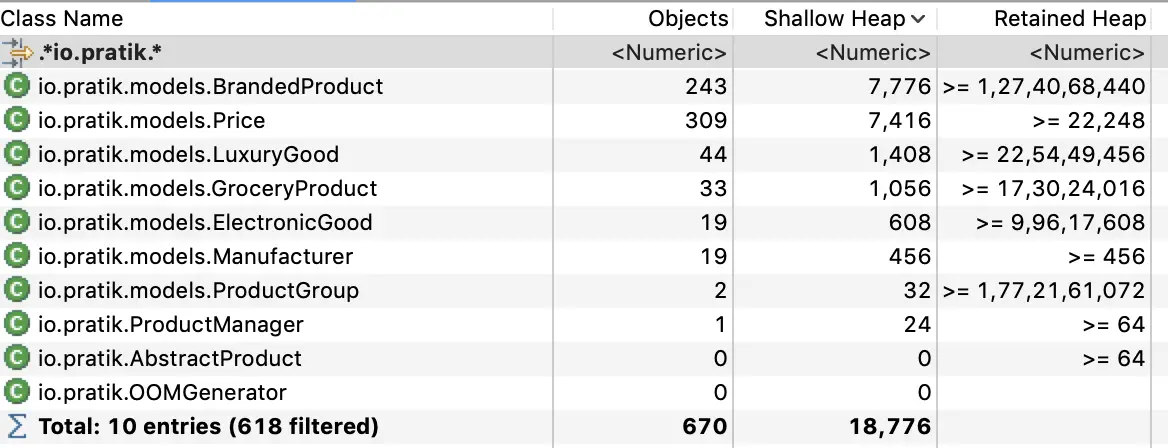
We have filtered the histogram with a regular expression “io.pratik.* " to show only the classes that match the pattern. With this view, we can see the number of live objects: for example, 243 BrandedProduct objects, and 309 Price Objects are alive in the system. We can also see the amount of memory each object is using.
There are two calculations, Shallow Heap and Retained Heap. A shallow heap is the amount of memory consumed by one object. An Object requires 32 (or 64 bits, depending on the architecture) for each reference. Primitives such as integers and longs require 4 or 8 bytes, etc… While this can be interesting, the more useful metric is the Retained Heap.
Retained Heap Size
The retained heap size is computed by adding the size of all the objects in the retained set. A retained set of X is the set of objects which would be removed by the Garbage Collector when X is collected.
The retained heap can be calculated in two different ways, using the quick approximation or the precise retained size:
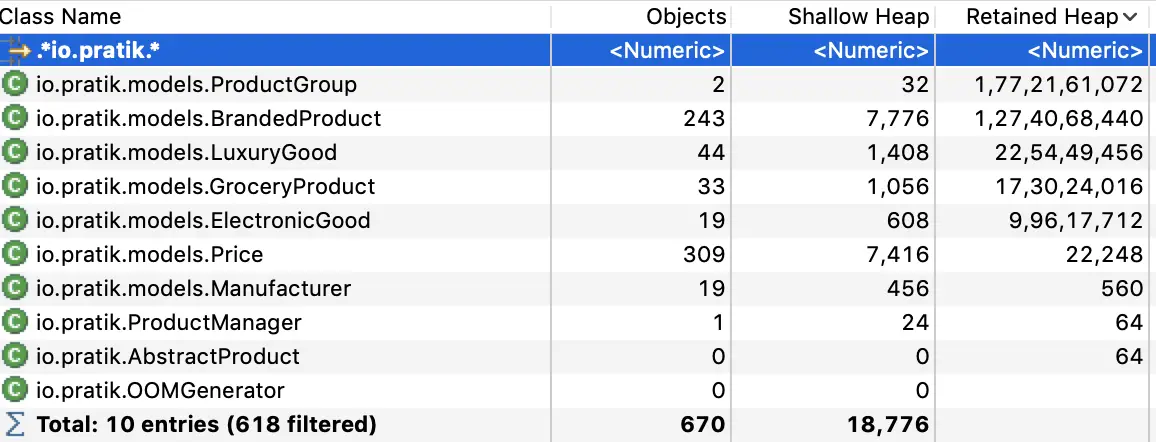
By calculating the Retained Heap we can now see that io.pratik.ProductGroup is holding the majority of the memory, even though it is only 32 bytes (shallow heap size) by itself. By finding a way to free up this object, we can certainly get our memory problem under control.
Dominator Tree
The dominator tree is used to identify the retained heap. It is produced by the complex object graph generated at runtime and helps to identify the largest memory graphs. An Object X is said to dominate an Object Y if every path from the Root to Y must pass through X.
Looking at the dominator tree for our example, we can see which objects are retained in the memory.

We can see that the ProductGroup object holds the memory instead of the Thread object. We can probably fix the memory problem by releasing objects contained in this object.
Leak Suspects Report
We can also generate a “Leak Suspects Report” to find a suspected big object or set of objects. This report presents the findings on an HTML page and is also saved in a zip file next to the heap dump file.
Due to its smaller size, it is preferable to share the “Leak Suspects Report” report with teams specialized in performing analysis tasks instead of the raw heap dump file.
The report has a pie chart, which gives the size of the suspected objects:
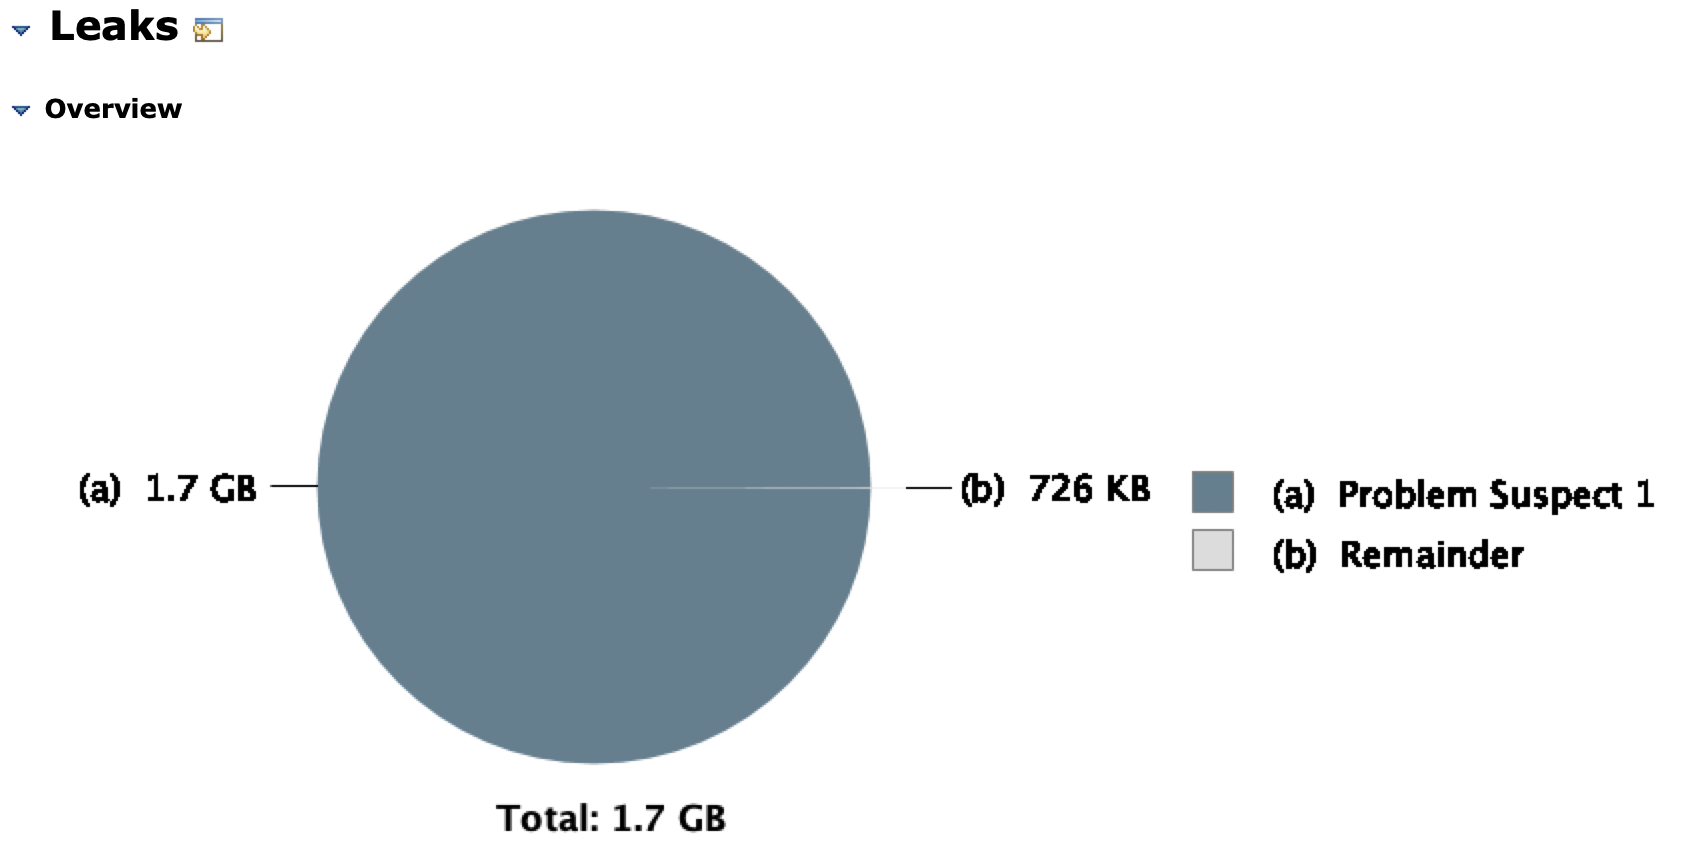
For our example, we have one suspect labeled as “Problem Suspect 1” which is further described with a short description:
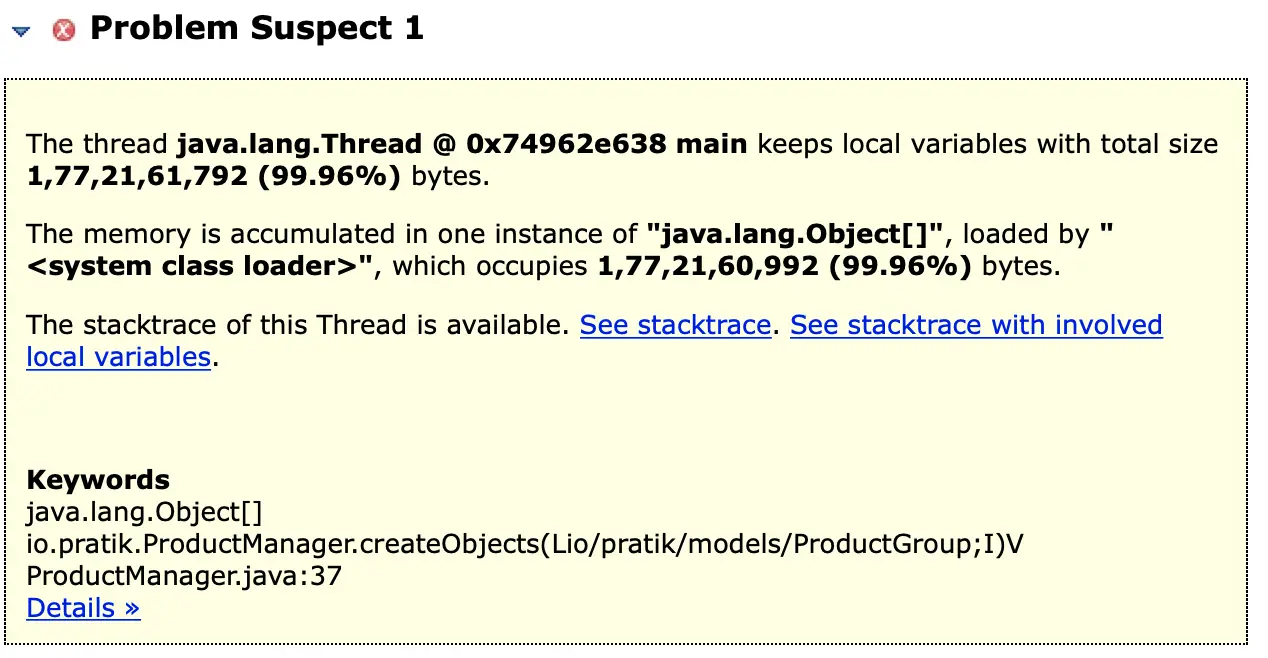
Apart from the summary, this report also contains detailed information about the suspects which is accessed by following the “details” link at the bottom of the report:
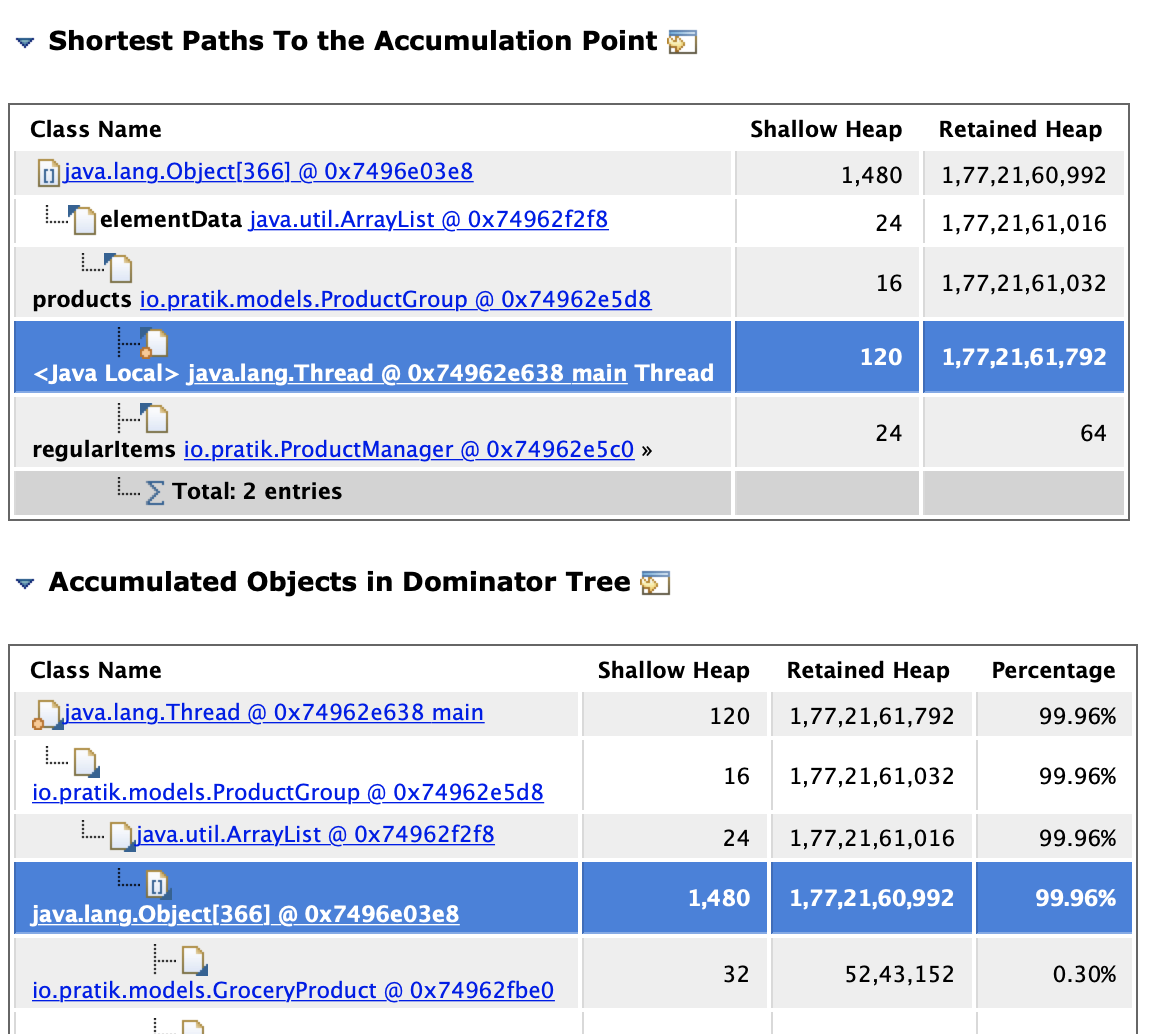
The detailed information is comprised of :
-
Shortest paths from GC root to the accumulation point: Here we can see all the classes and fields through which the reference chain is going, which gives a good understanding of how the objects are held. In this report, we can see the reference chain going from the
Threadto theProductGroupobject. -
Accumulated Objects in Dominator Tree: This gives some information about the content which is accumulated which is a collection of
GroceryProductobjects here.
Conclusion
In this post, we introduced the heap dump, which is a snapshot of a Java application’s object memory graph at runtime. To illustrate, we captured the heap dump from a program that threw an OutOfMemoryError at runtime.
We then looked at some of the basic concepts of heap dump analysis with Eclipse Memory Analyzer: large objects, GC roots, shallow vs. retained heap, and dominator tree, all of which together will help us to identify the root cause of specific memory issues.


